June 15, 2026
Typhoon No. 6 (JANGMI) in 2026
Overview of the Typhoon
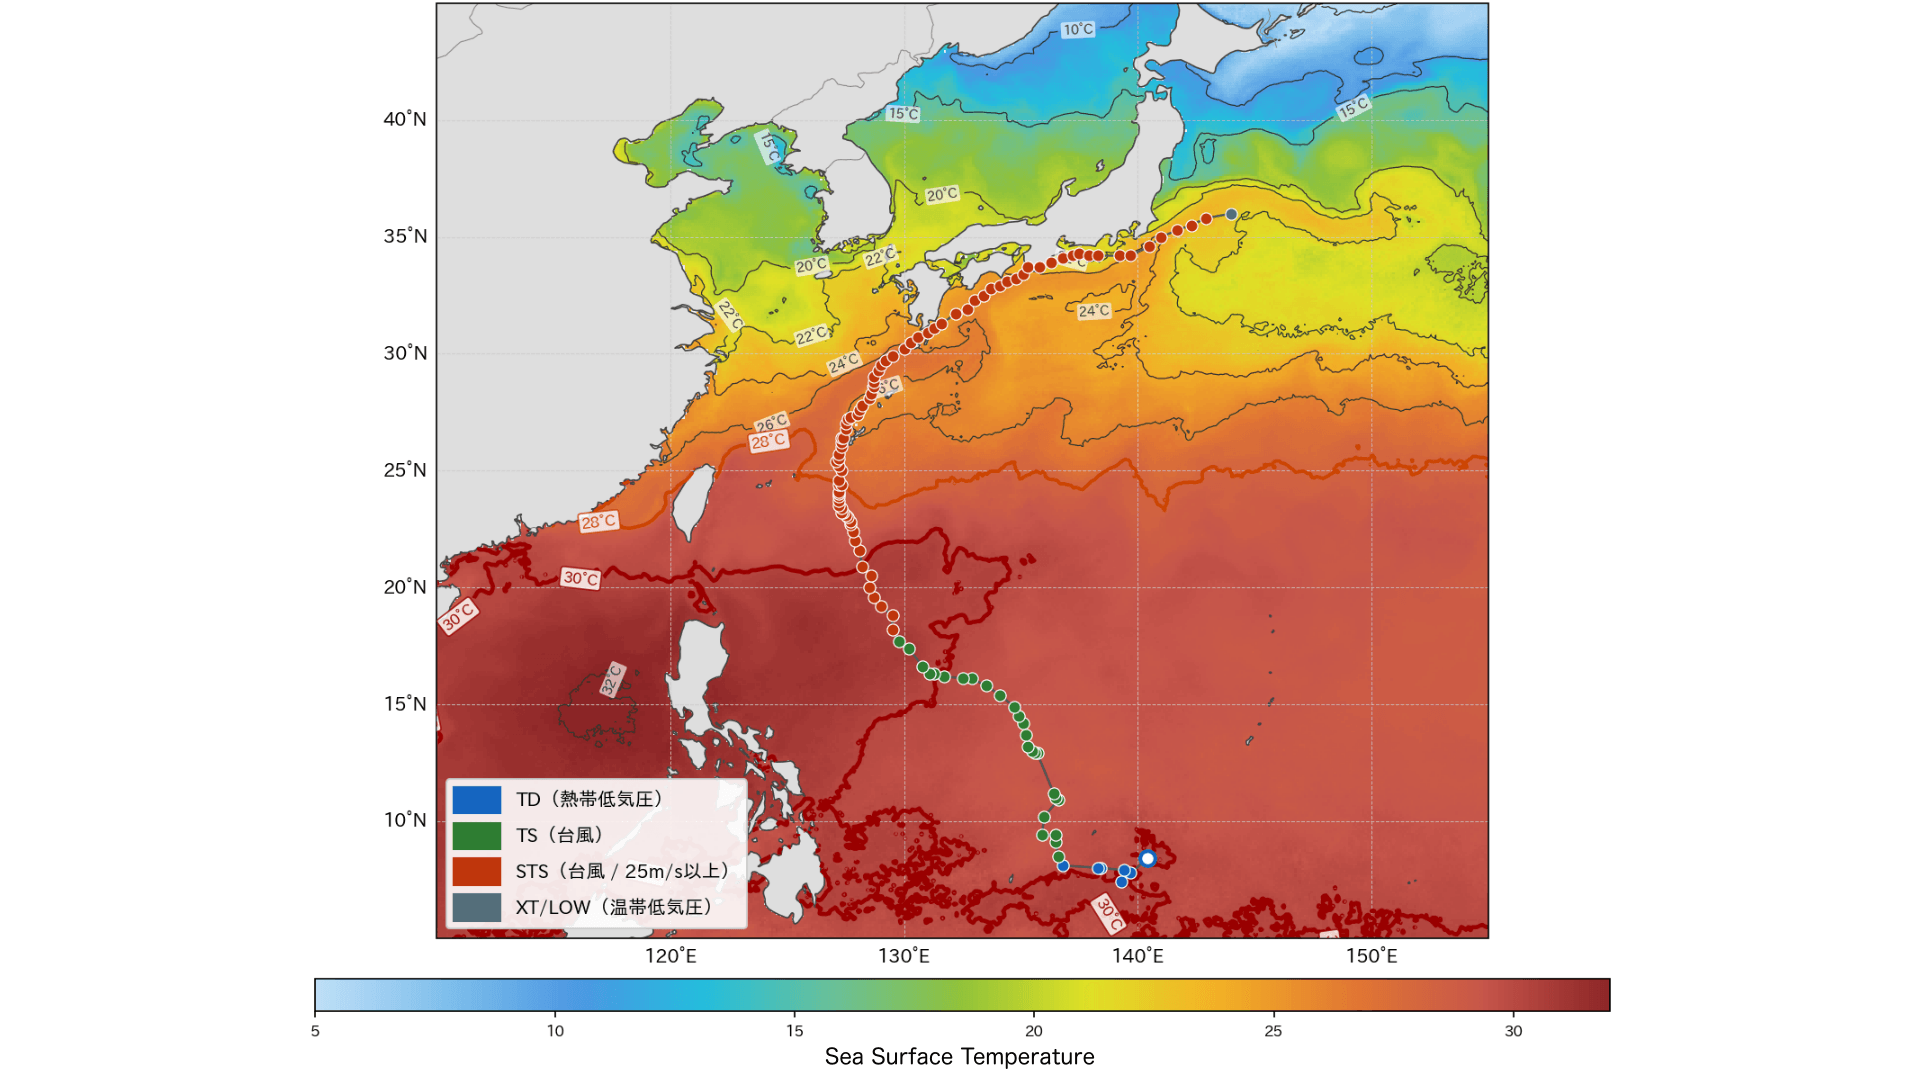
At 00:00 UTC on May 27, 2026, Typhoon No. 6 (JANGMI) formed over the waters near the Caroline Islands. After developing, it tracked northwestward while steadily intensifying. On the night of June 1, it approached and made a direct hit on Okinawa's main island while still carrying a storm-force wind area. The following day, June 2, it passed closest to the Amami region, moved north of Tanegashima Island, and reached the waters southeast of Kyushu.
The typhoon then continued on an east-northeastward course and made landfall in southern Wakayama Prefecture at approximately 19:30 UTC on June 2. After coming ashore, it traveled along Japan's Pacific coast, bringing heavy rain and strong winds to Kyushu, Shikoku, the Kansai region, Tokai, and Kanto-Koshin. It transitioned into an extratropical cyclone east of the Kanto region at 12:00 UTC the same day.
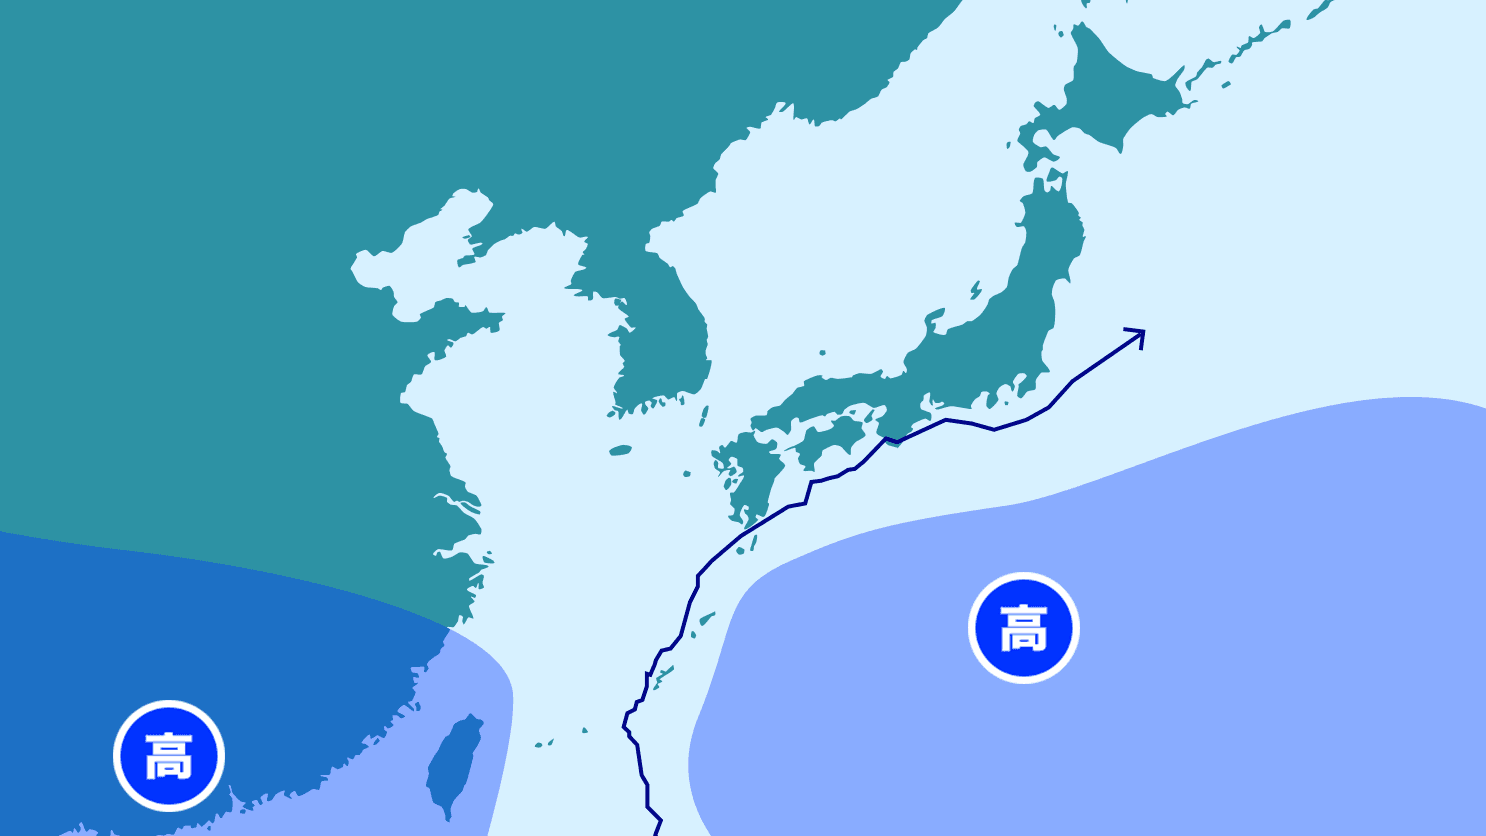
Statistically, typhoons in June tend to head toward the Asian continent, and even when they do approach Japan, they usually pass well to the south of the country. Several factors explain why Typhoon No. 6 took such an unusual track toward Japan. A high-pressure system to the west of Japan strengthened under the influence of the westerlies, and enhanced tropical convective activity reinforced the Pacific High beyond its usual strength, steering the typhoon farther north than is typical. Sea surface temperatures around Japan were also above average, which allowed the typhoon to maintain its intensity as it approached and crossed the region.
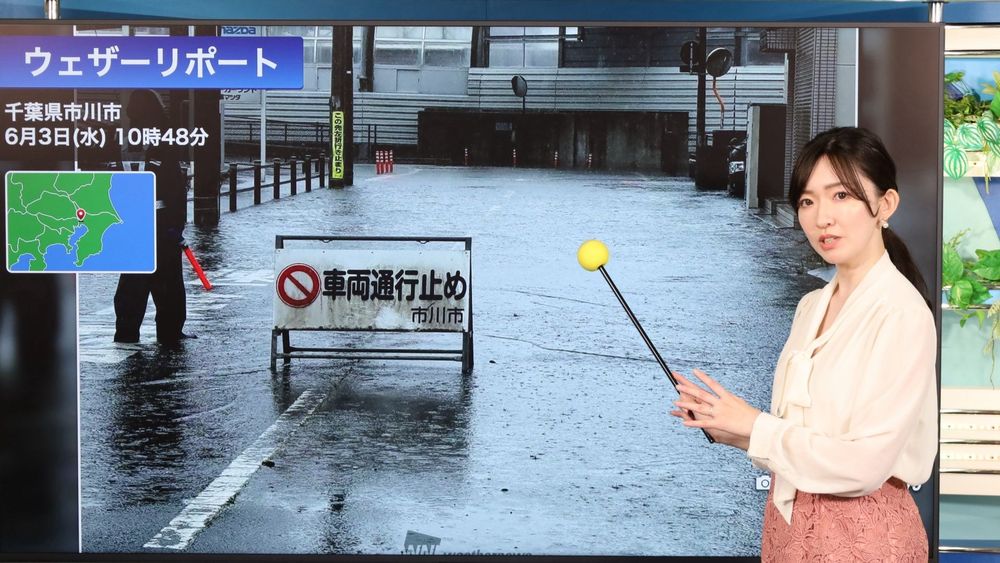
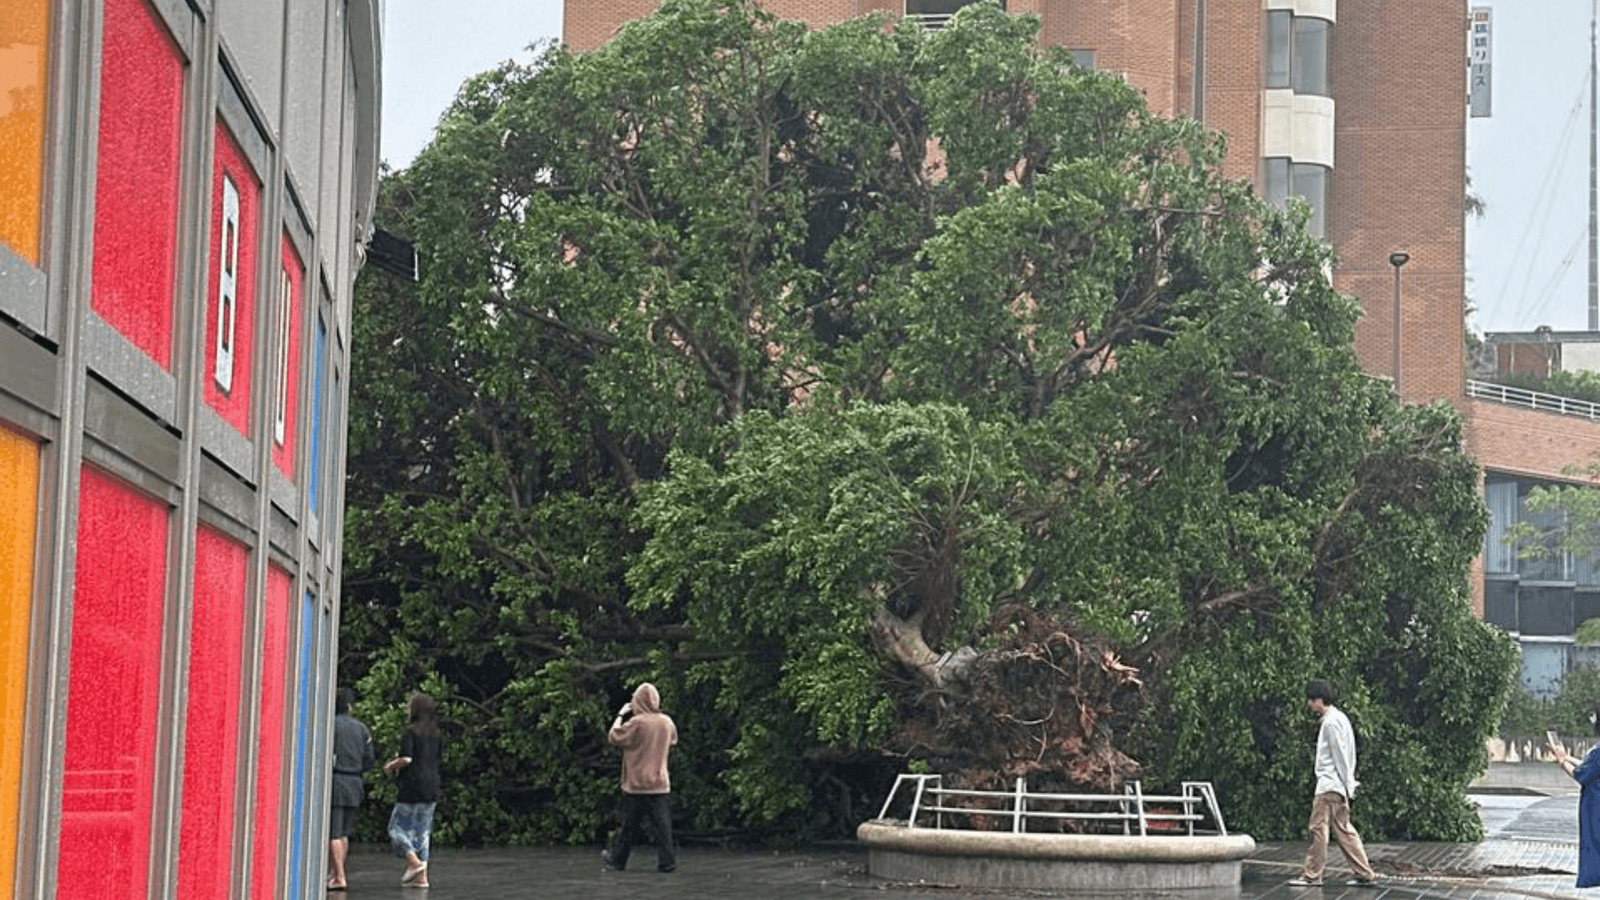
Typhoon No. 6 caused a wide range of impacts across Japan.
In Uruma City, Okinawa Prefecture, maximum instantaneous wind speeds exceeded 40 m/s. These strong winds caused widespread disruption, including power outages affecting more than 30,000 households, flight cancellations, and the suspension of bus services and the Yui Rail system. Regional transportation networks were severely affected, causing significant disruption to daily life and infrastructure.
In the Shikoku, Kinki, and Tokai regions, localized heavy rainfall led to rapid rises in river levels. Along the Koza River in Wakayama Prefecture, water flowed over the river embankments in an event known as overtopping. In Kushimoto Town, a Level 5 Special Flood Warning was issued. This is the highest level of warning and signals an imminent threat to life, underscoring the extreme danger posed by the flooding.
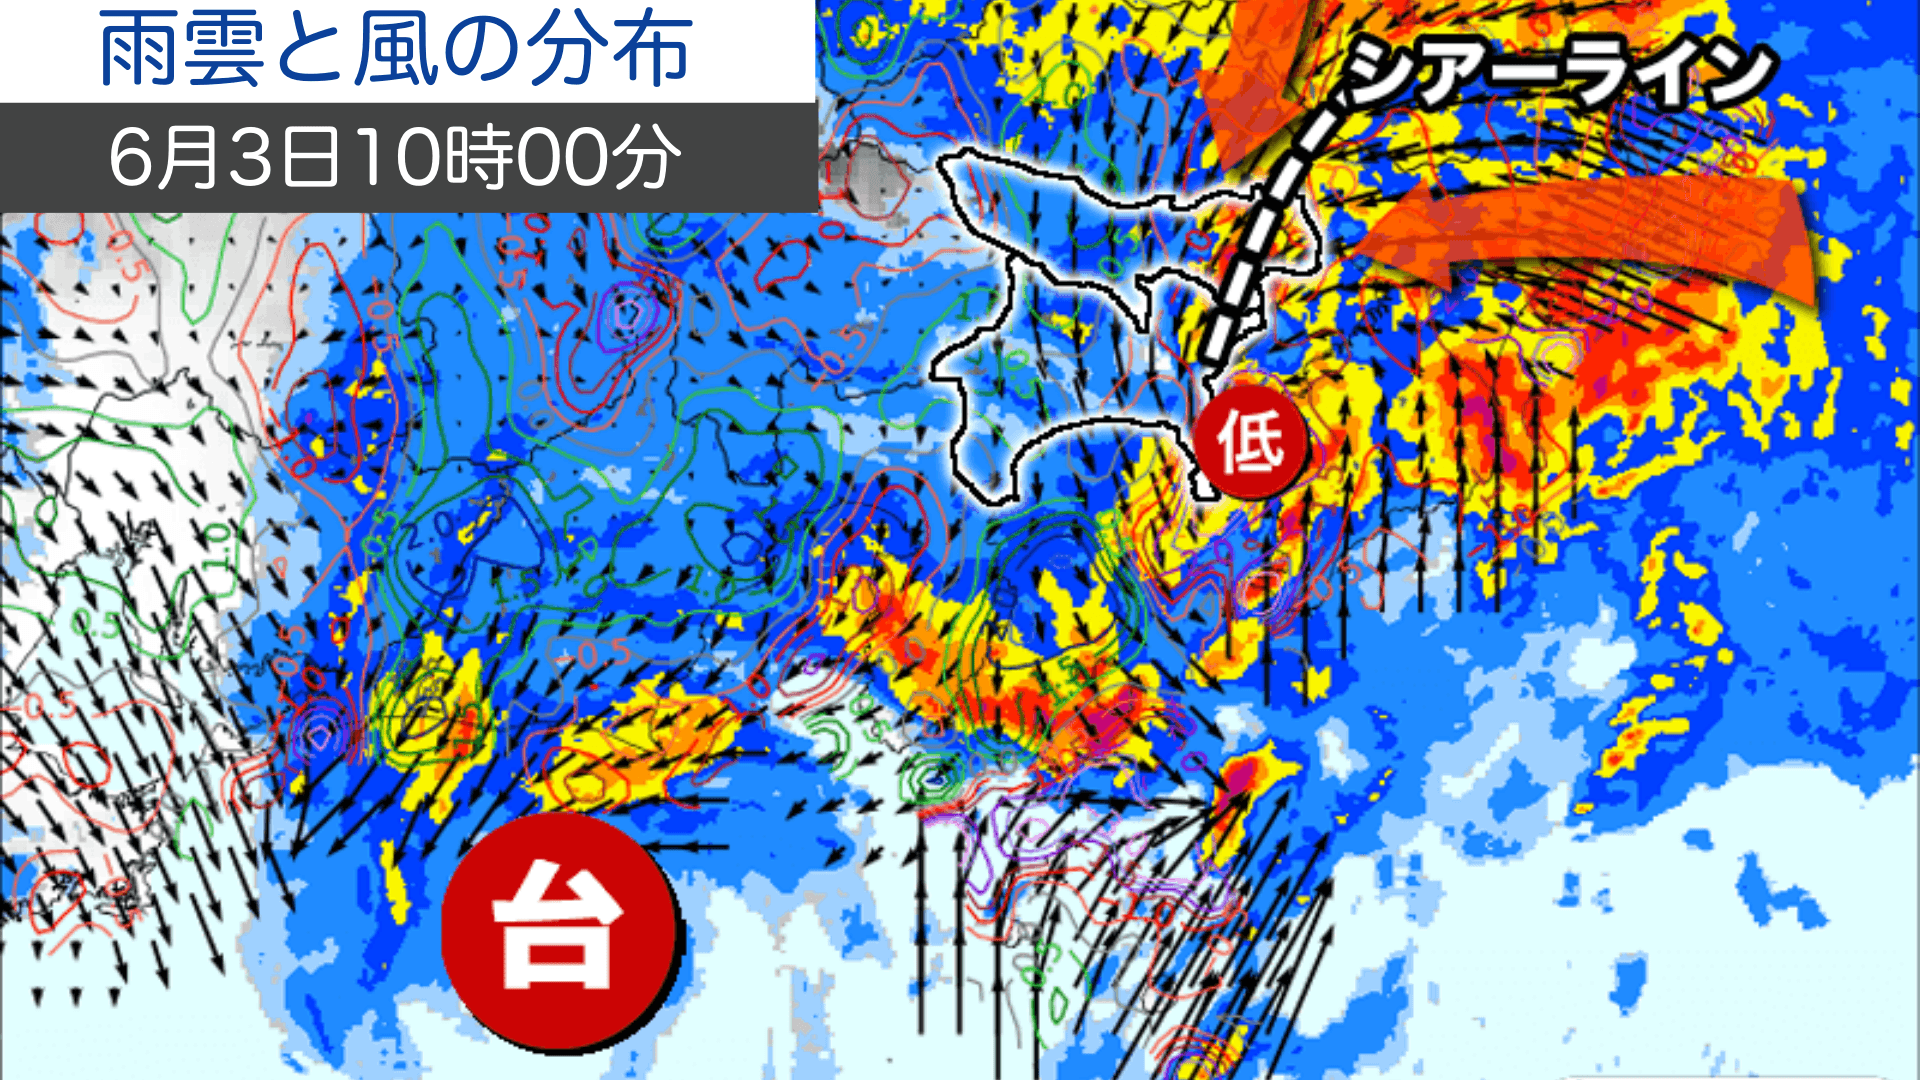
In the Kanto-Koshin region, rainfall became concentrated over urban areas as a shear line (a zone of converging winds) formed and a small-scale low-pressure system developed. Tokyo recorded 172.5 mm of rainfall in 12 hours, while Yokohama observed its highest June rainfall total on record. The exceptionally heavy rainfall caused water levels to rise rapidly along urban rivers such as the Meguro River and Kanda River, prompting multiple Level 4 Flood Risk Alerts.
Evaluating the Accuracy of the Typhoon Track Forecast
We evaluated forecasts for Typhoon No. 6 from nine numerical weather prediction models. Figure 1 shows the forecast tracks issued by each model at 00:00 UTC on May 27, 2026, before the typhoon had formed. In line with the actual track of Typhoon No. 6, many of the models predicted that the storm would approach Okinawa and then move northeastward along the southern coast of western and eastern Japan1.
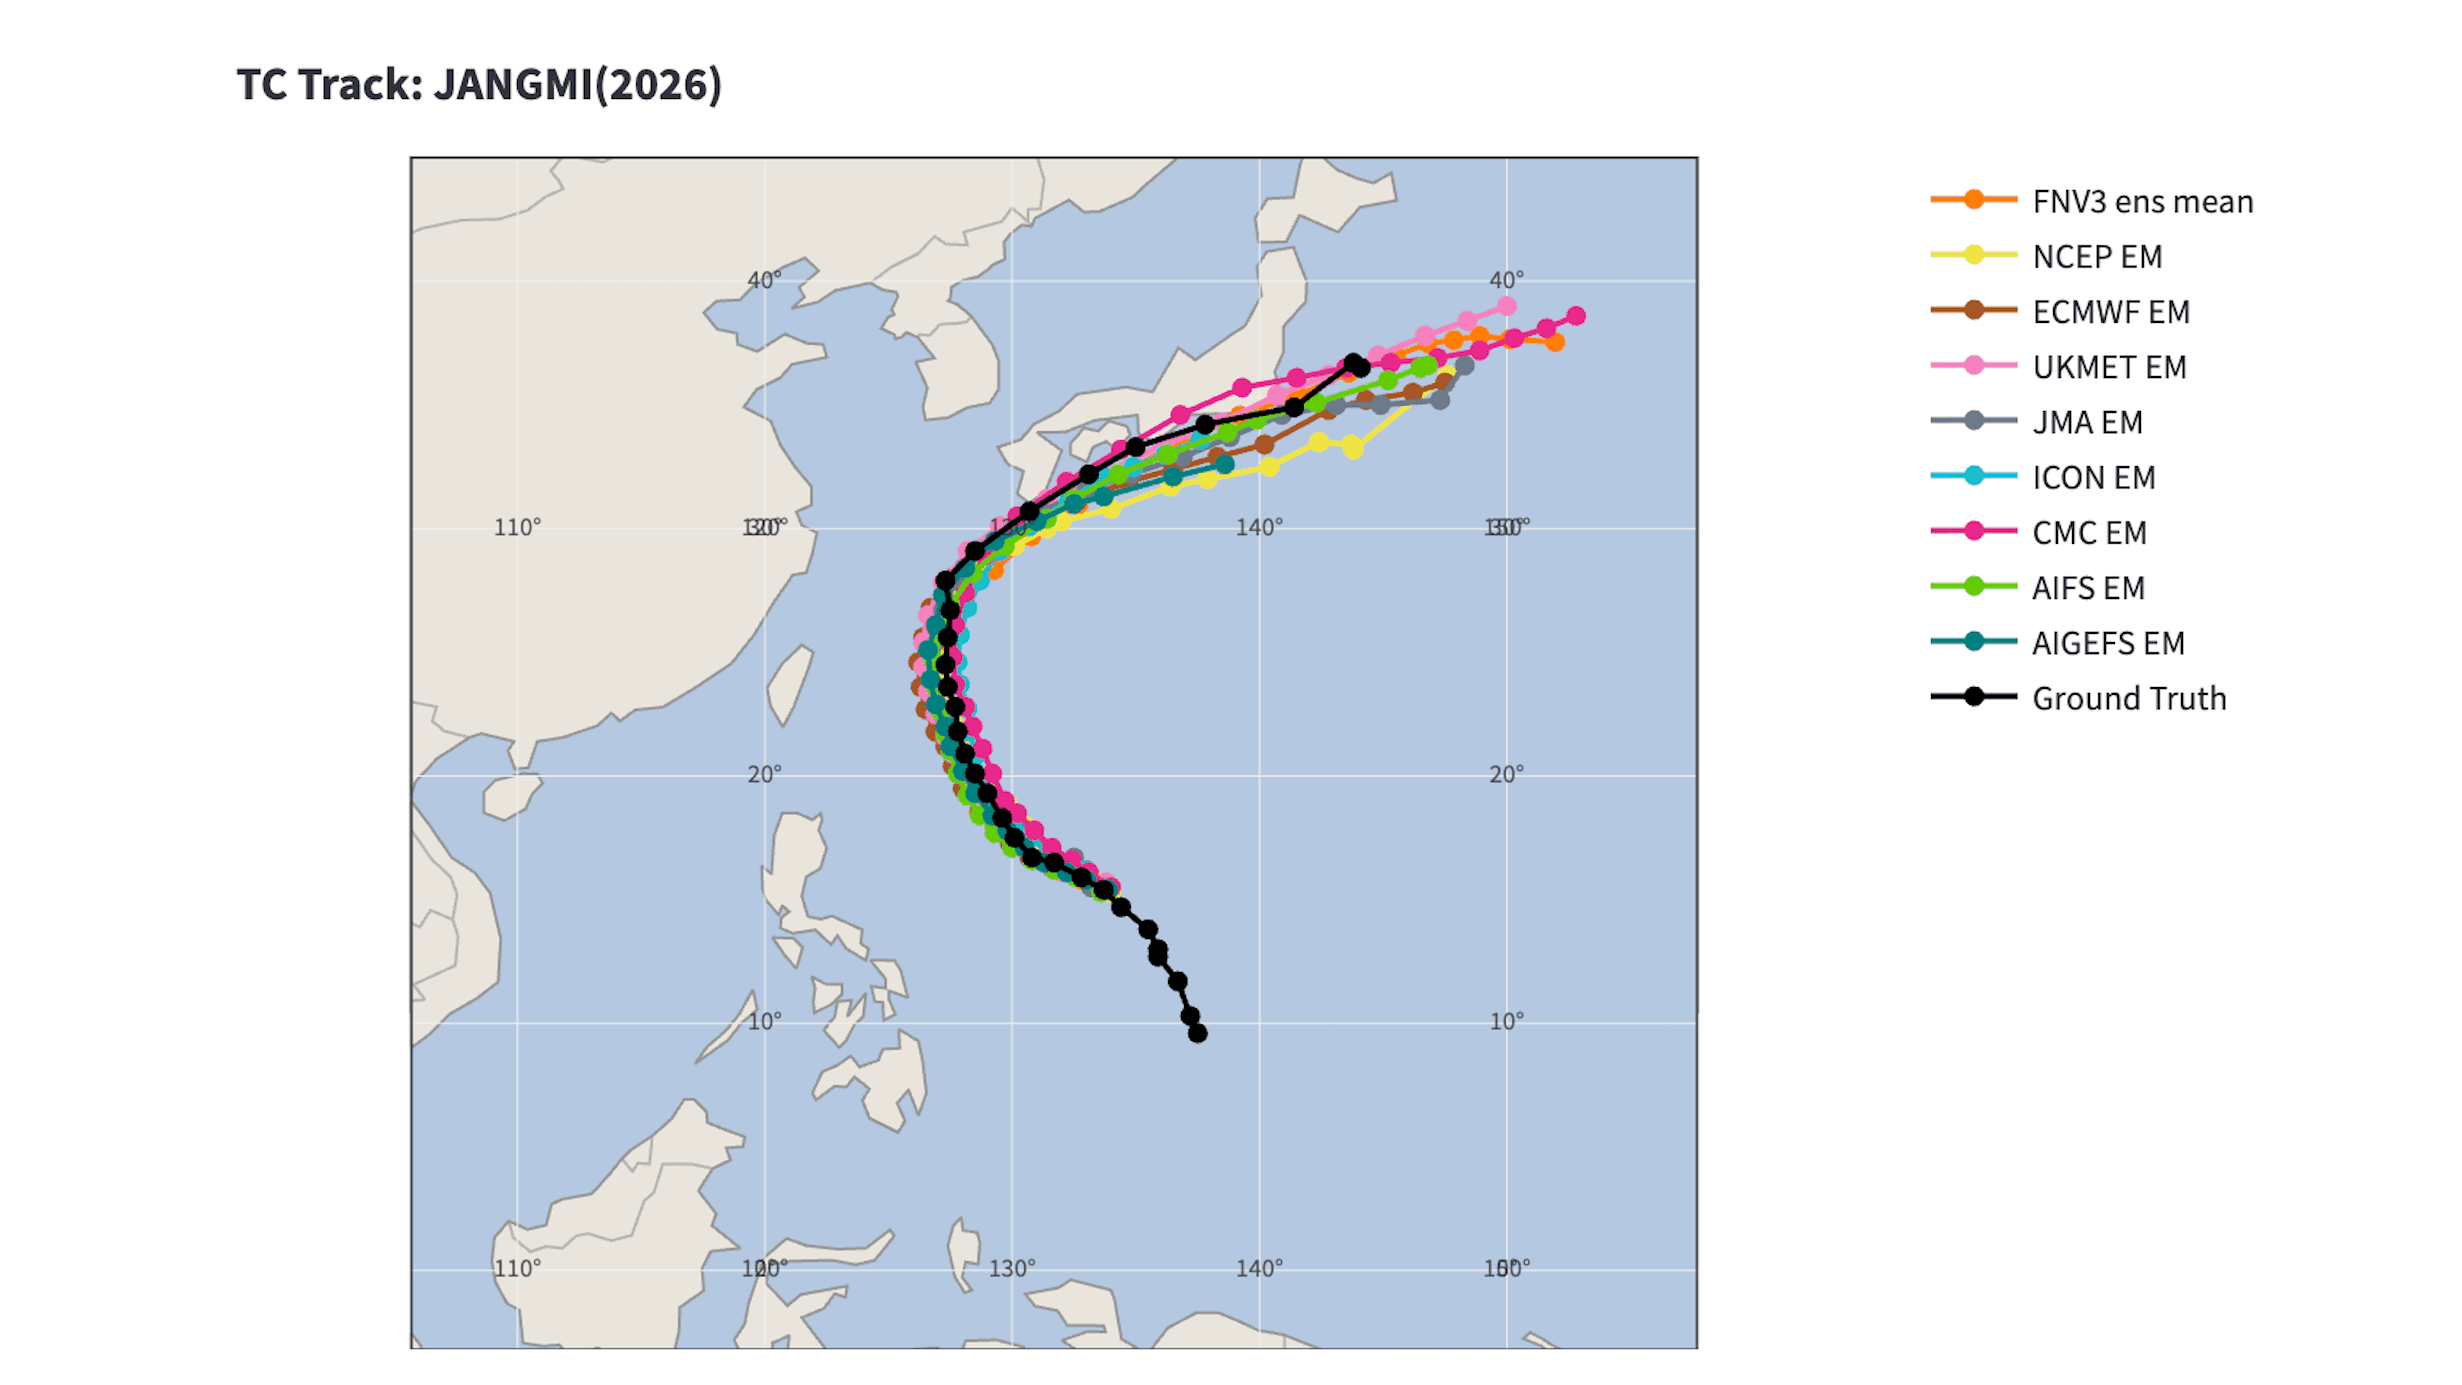
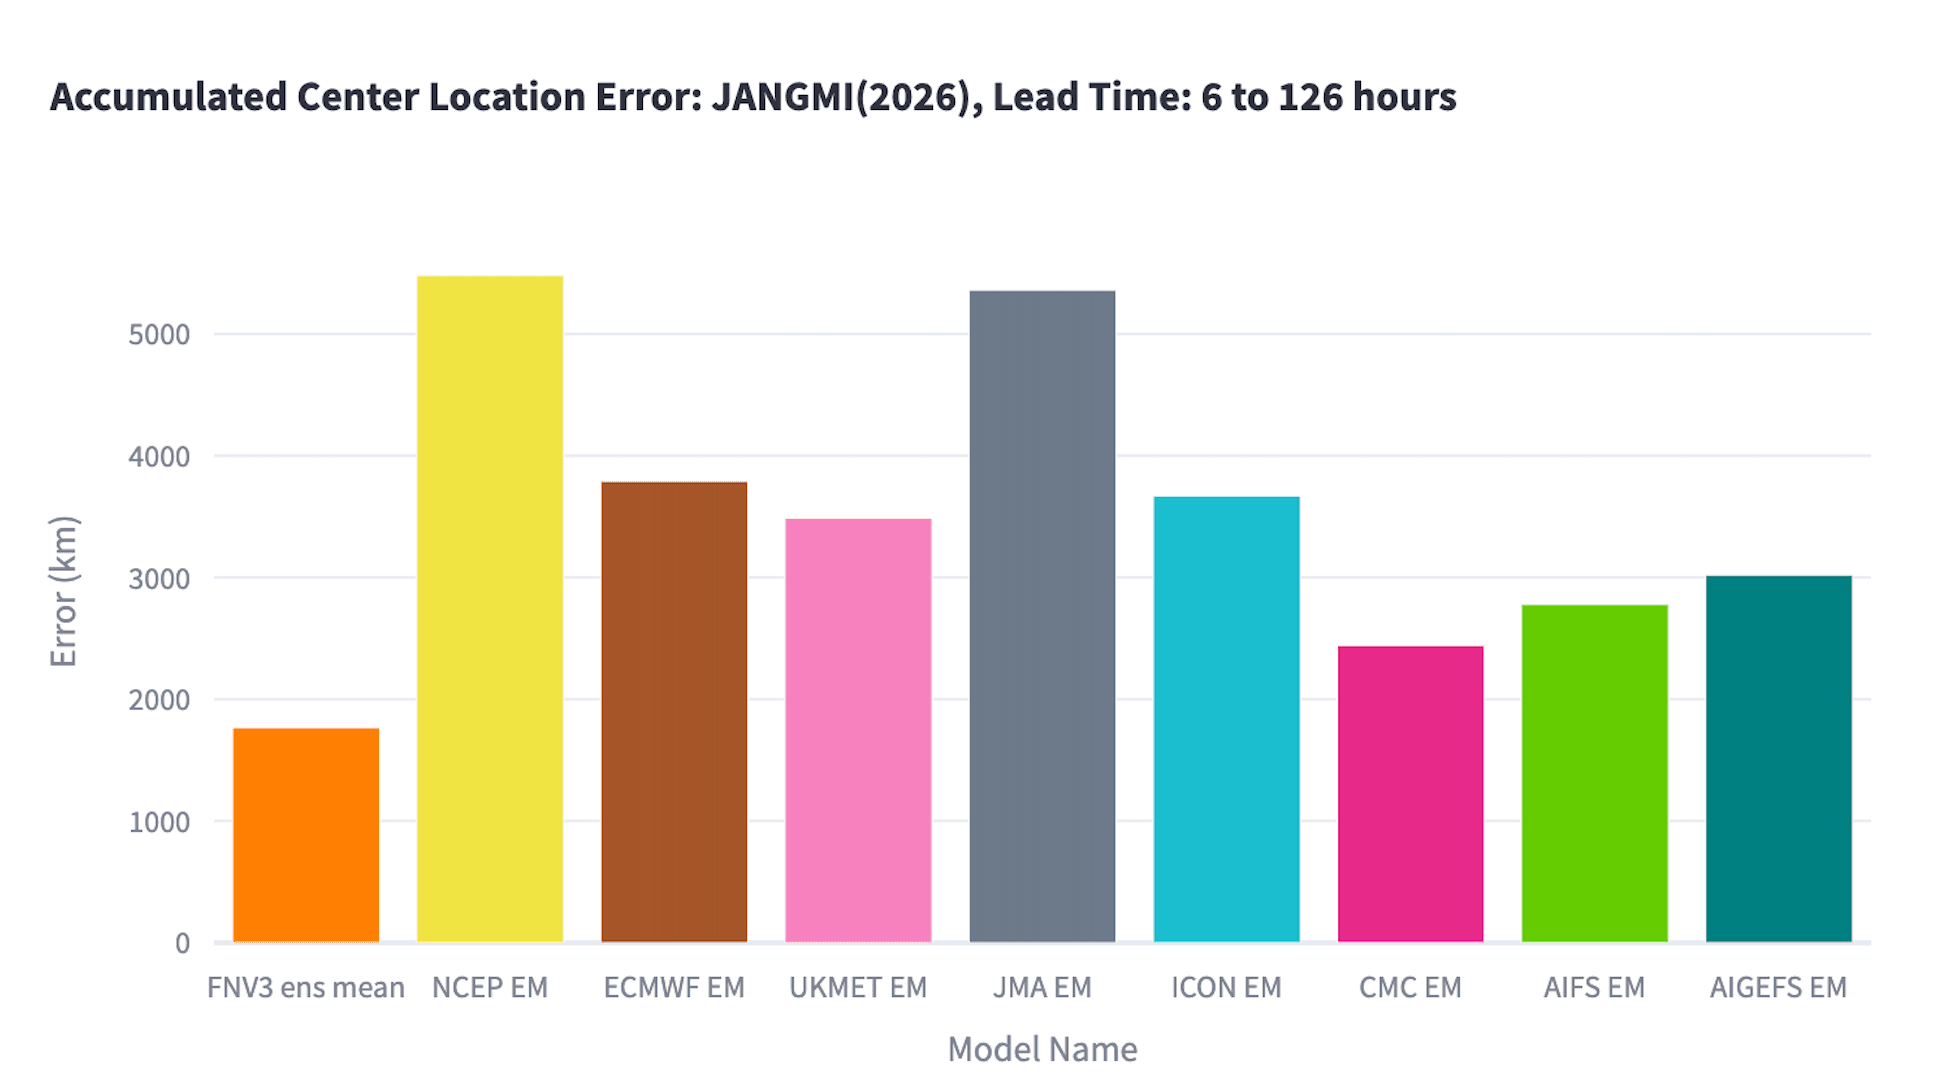
FNV ens mean: Google DeepMind (CC BY 4.0) NCEP EM: U.S. National Centers for Environmental Prediction ECMWF EM: European Centre for Medium-Range Weather Forecasts UKMET EM: UK Met Office JMA EM: Japan Meteorological Agency ICON EM: German Weather Service (DWD) CMC EM: Environment and Climate Change Canada AIFS EM: European Centre for Medium-Range Weather Forecasts AIGEFS EM: U.S. National Centers for Environmental Prediction (AI Global Ensemble Forecast System)
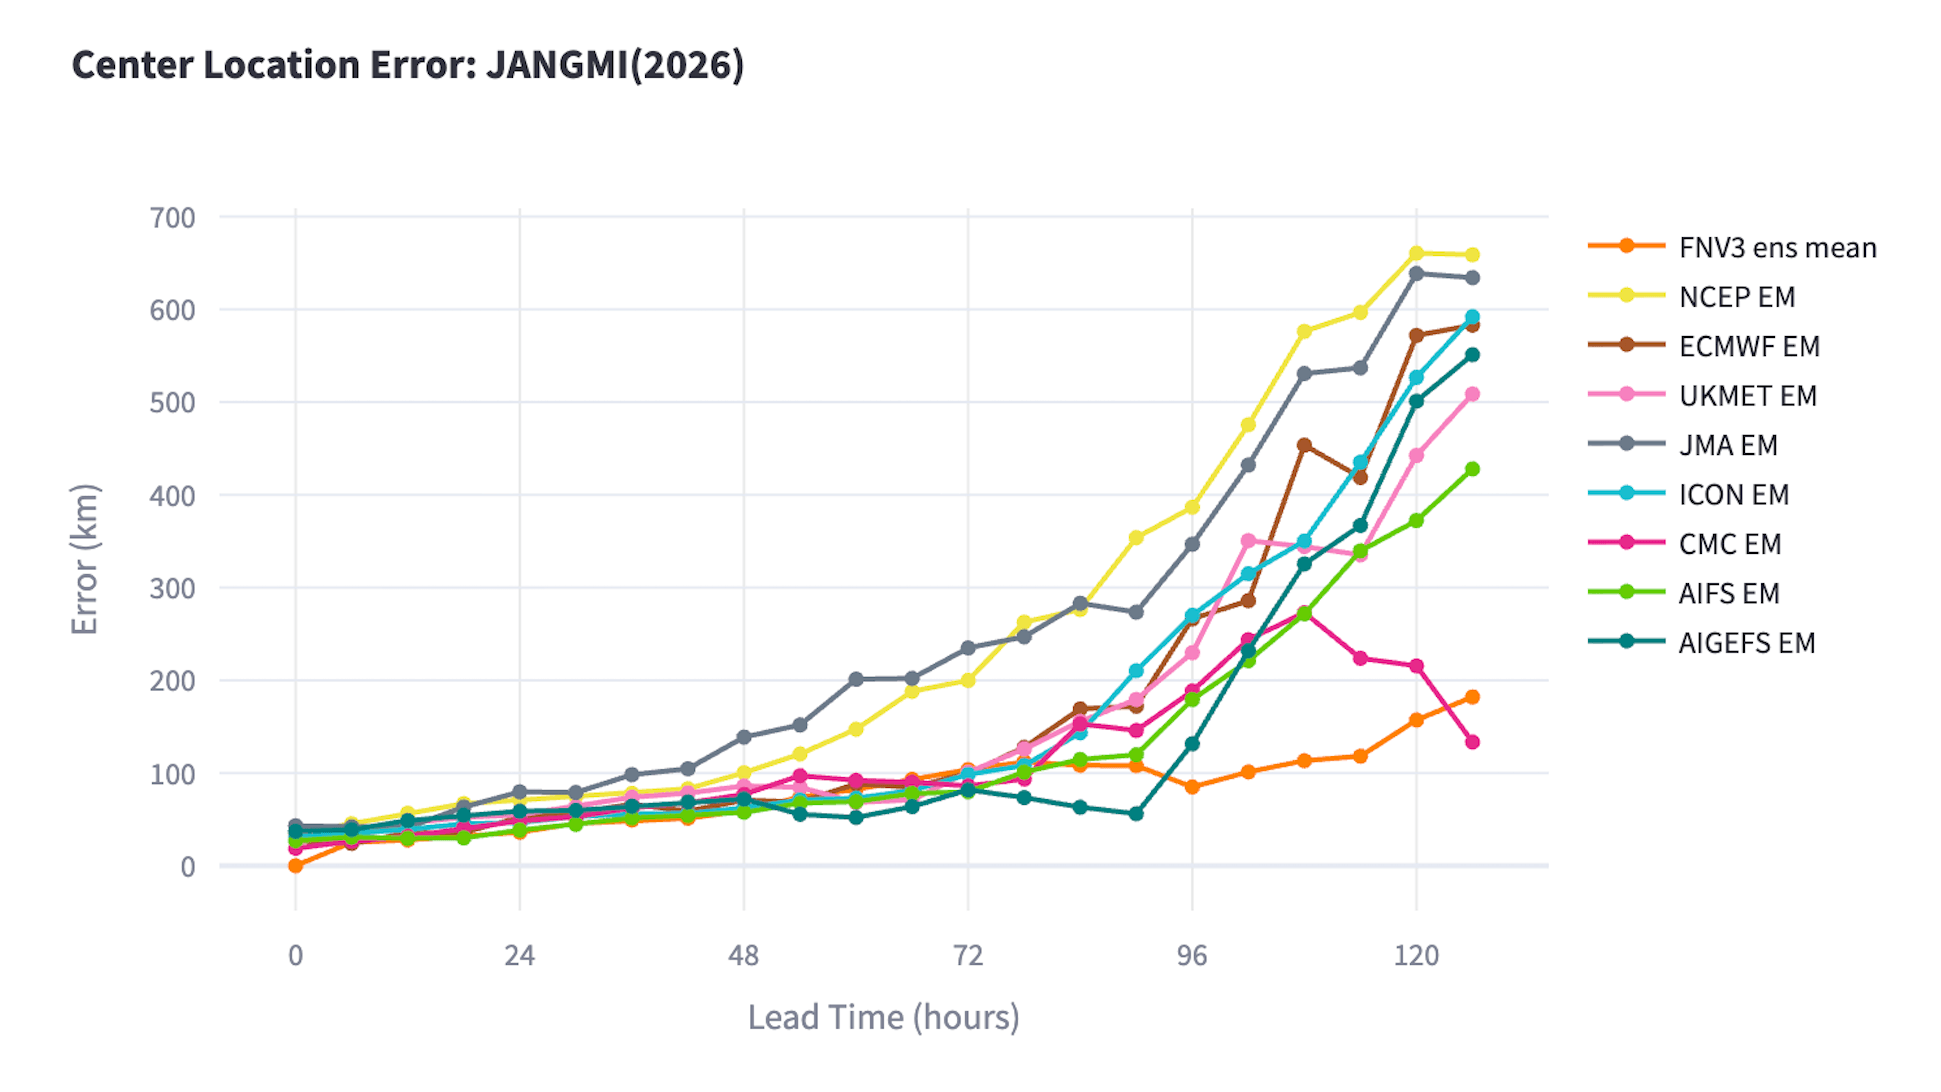
Figures 2 and 3 show the forecast errors in the predicted center position of the typhoon. The horizontal axis represents forecast lead time, while the vertical axis represents the distance error (km) between the forecast and observed typhoon positions. The forecast produced by Google DeepMind consistently delivered the lowest errors among all the models. Even at a lead time of 120 hours, its forecast errors remained below approximately 200 km.
At Weathernews, we use an ensemble forecasting approach that combines our own proprietary forecasting models with models from other institutions to deliver highly accurate forecasts. Through ongoing accuracy evaluations, we continuously work to improve our predictions. Going forward, we will keep rigorously verifying a wide range of forecasting models, including AI weather prediction models, so that we can deepen our understanding of each model's characteristics and deliver increasingly accurate weather information to our customers.
Reference: Using 200,000 Daily User Reports to Improve Forecast Accuracy
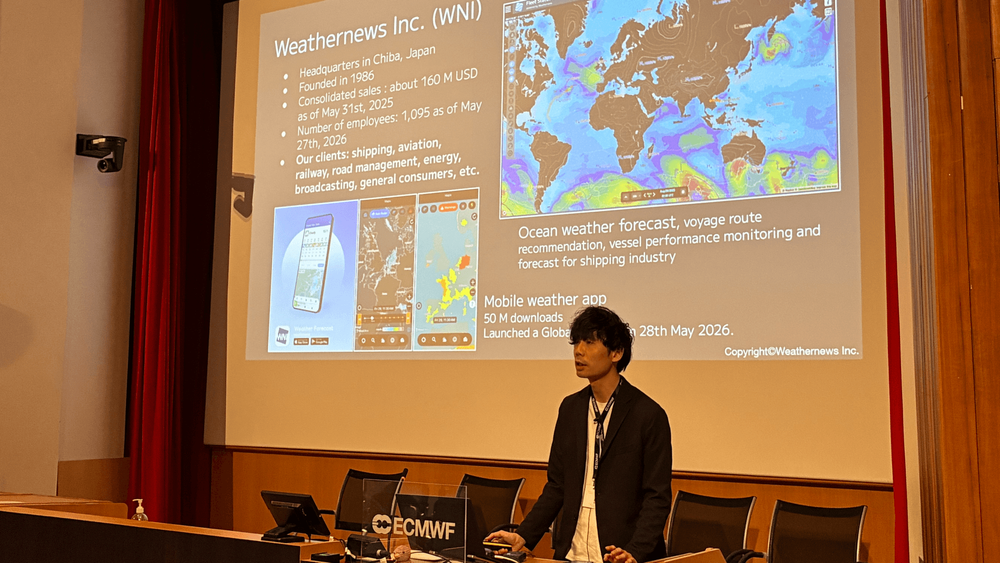
Weathernews incorporates user-submitted weather observations, known as Weather Reports, from users of the Weathernews app into its daily forecasting operations, helping to improve forecast accuracy2.
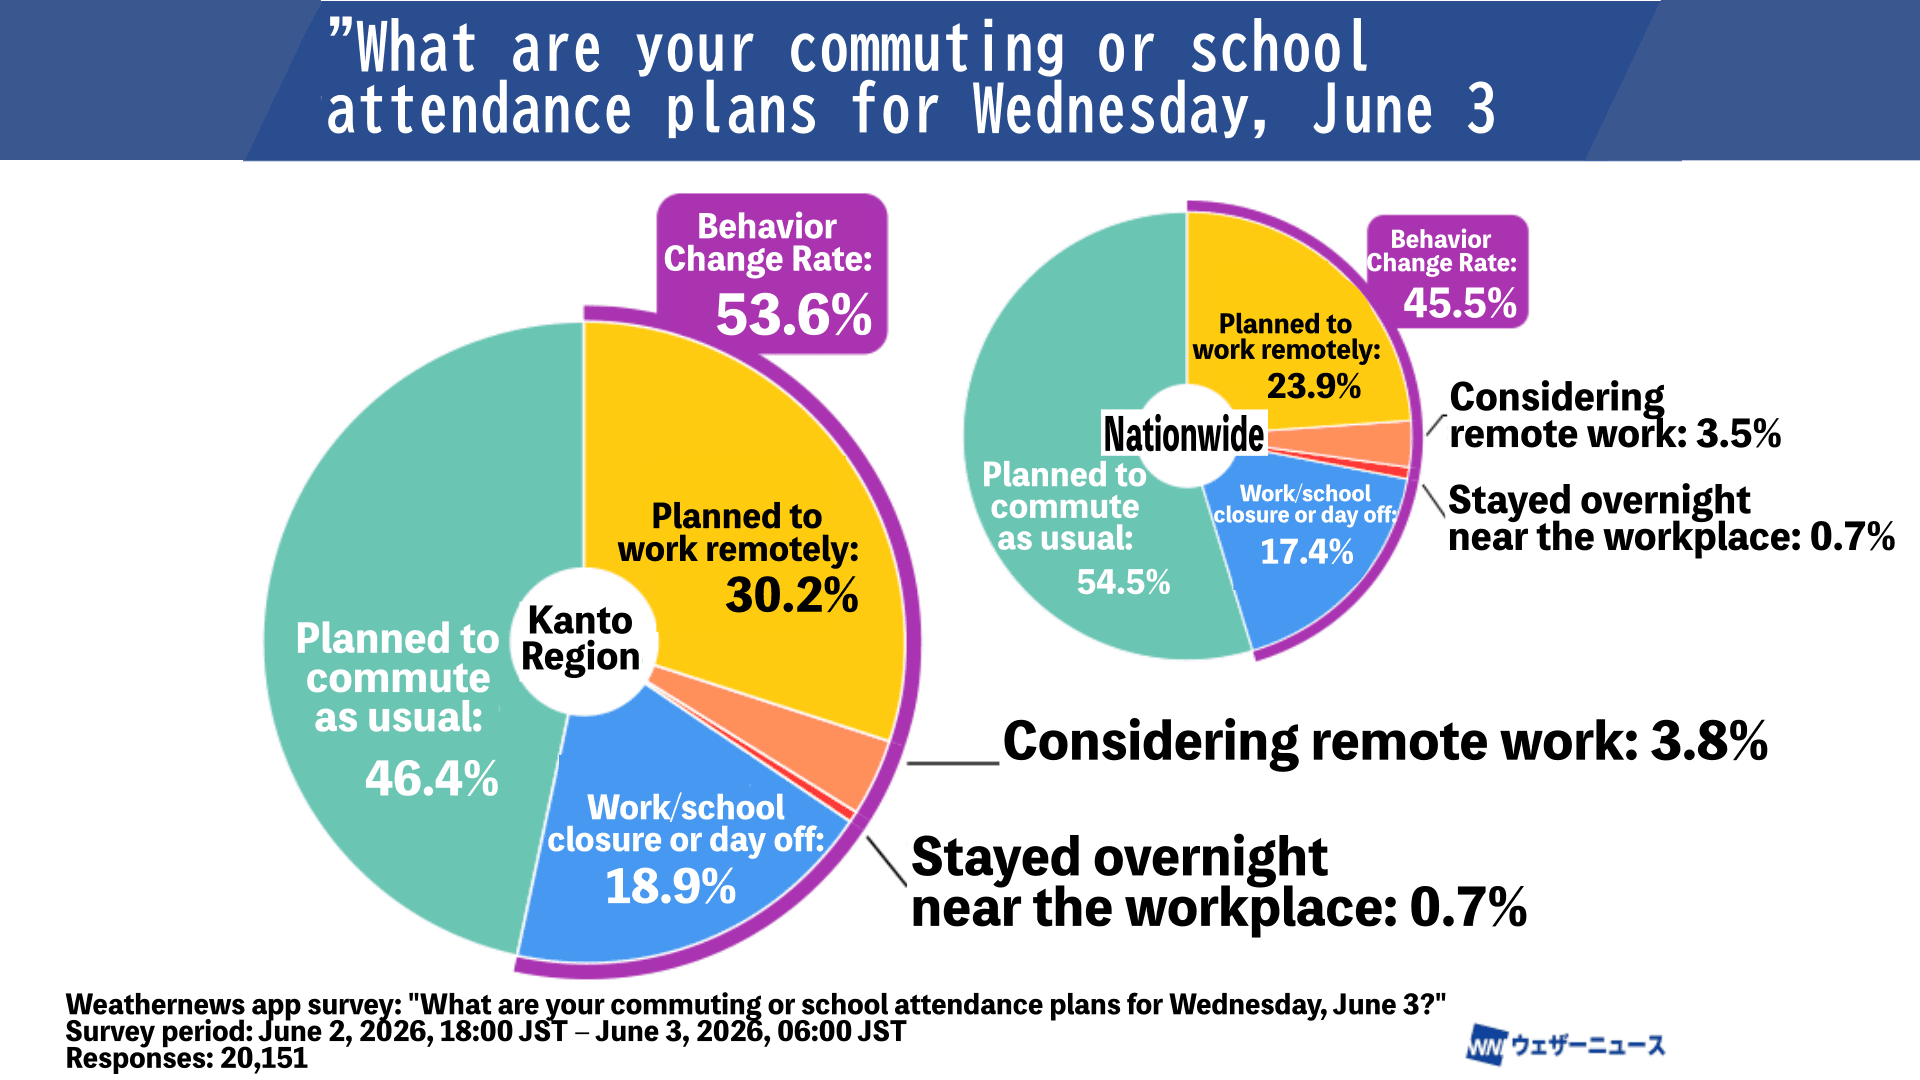
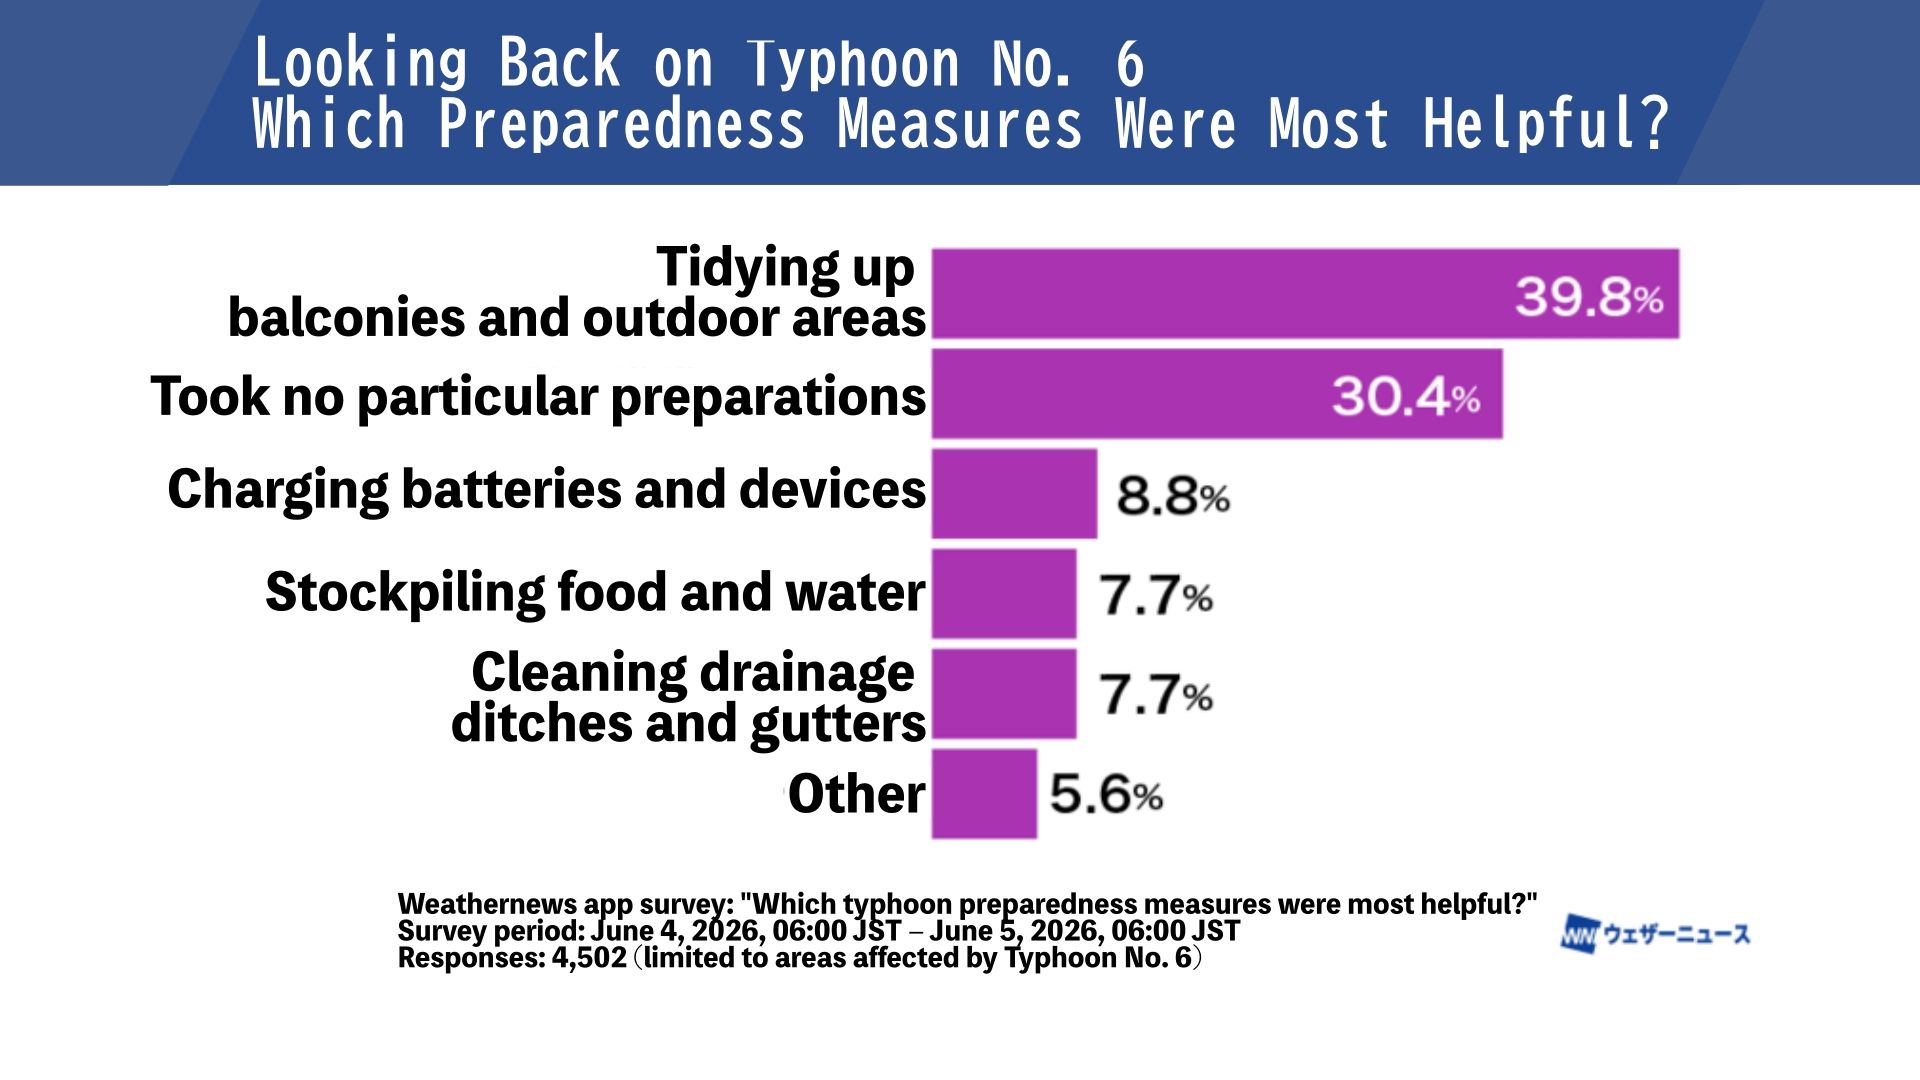
Delivering highly accurate weather information has also translated into concrete actions by users. As Typhoon No. 6 approached, 45.5% of respondents reported switching to remote work or temporarily suspending business operations. In addition, 39.8% took preventive measures against strong winds, such as securing or clearing items from their balconies. These results demonstrate meaningful behavioral changes driven by weather information.
To help people prepare in advance and take action that protects lives, we remain committed to further improving our forecast accuracy. By drawing on weather prediction models from around the world, our own proprietary forecasting systems, and the Weather Reports submitted by users, we will continue to deliver increasingly accurate and actionable weather information.

Footnotes
- 1:Figures 1– were created by the author using data from Google DeepMind GDM-FNV3 (CC BY 4.0), the U.S. National Centers for Environmental Prediction, the European Centre for Medium-Range Weather Forecasts, the UK Met Office, the Japan Meteorological Agency, the German Weather Service, and Environment and Climate Change Canada. ↩︎
- 2:For more information, see our related article, "No.1 Forecast Accuracy for Four Consecutive Years: Behind the Evaluation Process and Three Keys to Better Forecasting." ↩︎
Share