September 19, 2025
September 2025: Typhoon No. 15 Delivers Record Rain and Tornado to Japan
Meteorological Overview:
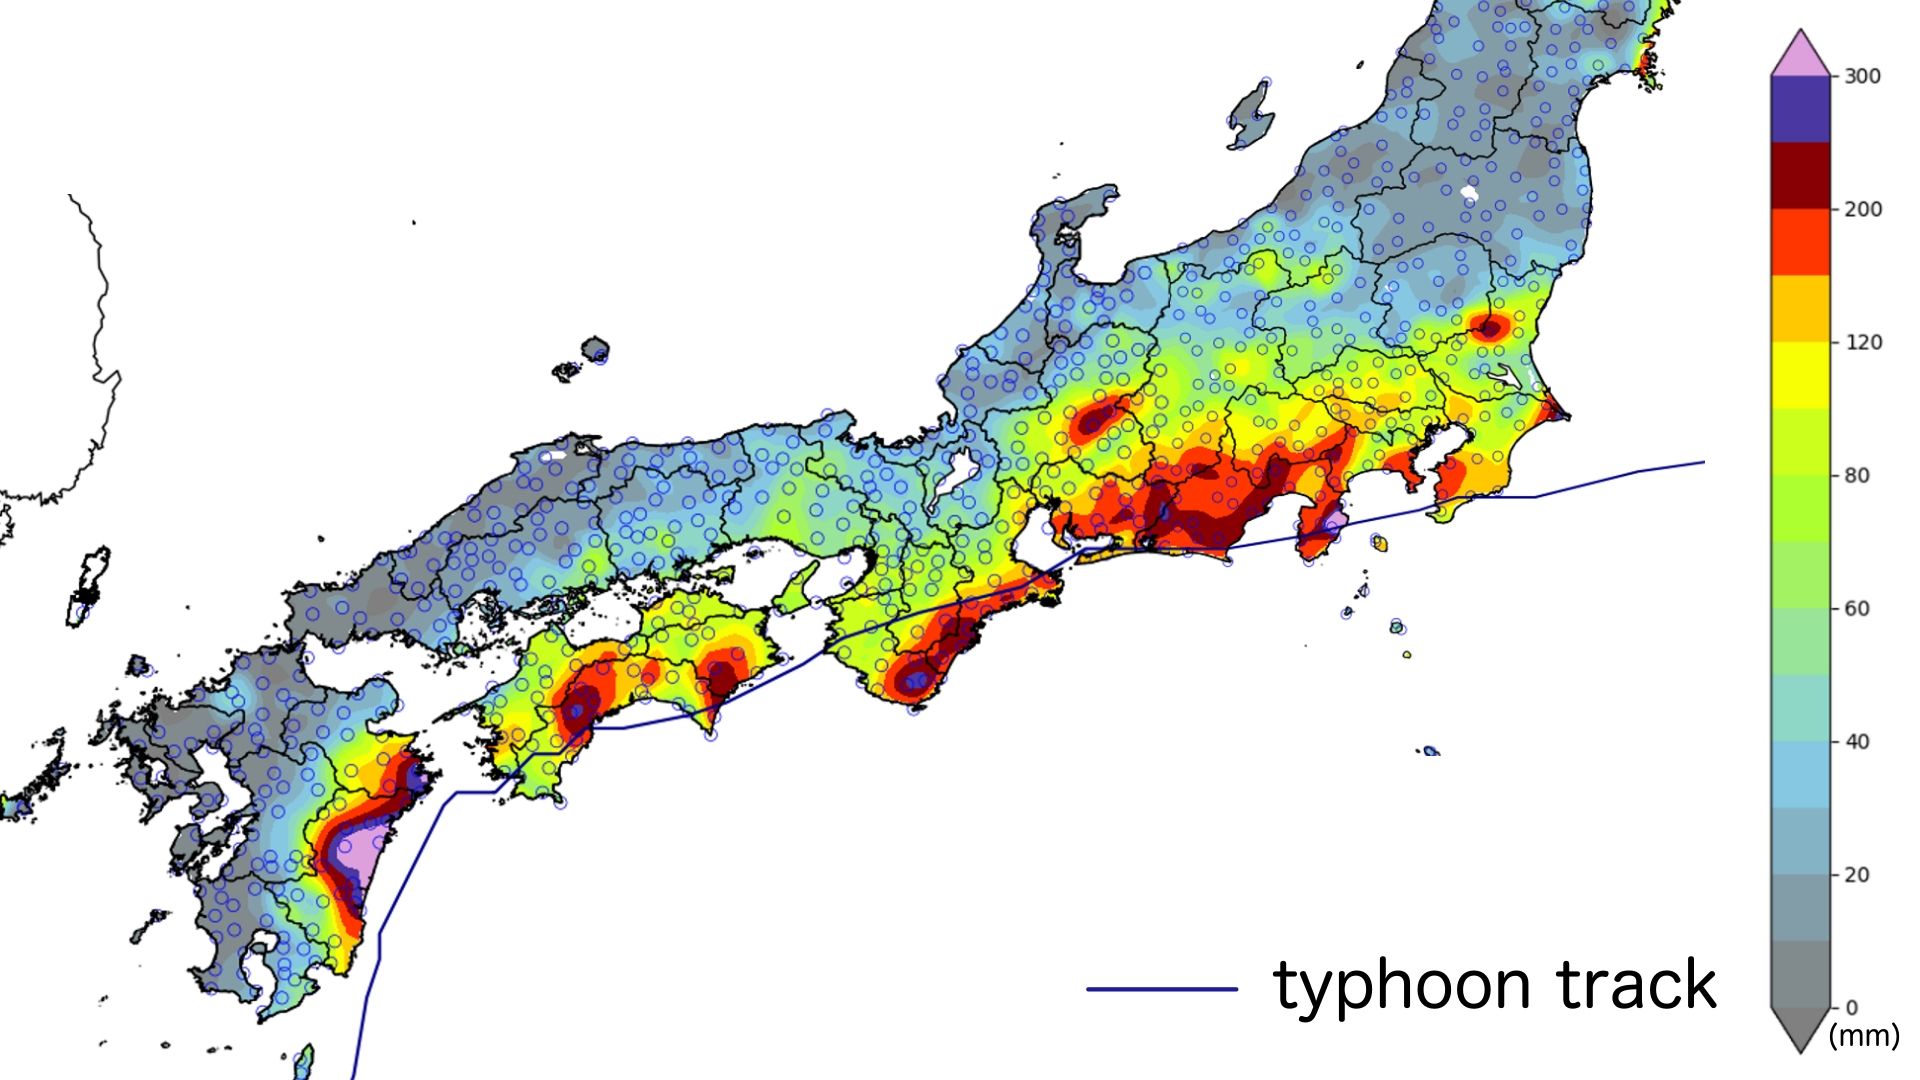
On September 3 at around 6 PM UTC, a tropical depression southeast of Minami Daitō Island strengthened into Typhoon No. 15. The storm first headed north, then shifted northeast, skirting Miyazaki Prefecture's coast before hitting land near Sukumo City in Kōchi Prefecture around 4 PM on September 4. It made a second landfall in northern Wakayama Prefecture around midnight on September 5, then raced eastward at about 60 km/h along Japan's Pacific coast, hammering coastal areas especially hard(Figure1)。
Even before the typhoon came ashore, it was already wreaking havoc. As it approached and clashed with a stationary front, it pulled warm, humid air up from the south into Honshu, triggering record-breaking downpours across western and eastern Japan's Pacific coast. Dangerous linear rainbands formed over Miyazaki, Shizuoka, and Kanagawa Prefectures. In Kikugawa and Makinohara in Shizuoka Prefecture, plus Shizuoka Airport, rain was falling at over 100 mm per hour. Tsuno in Miyazaki got slammed with 465.5 mm of rain in just 24 hours, surpassing the region’s normal monthly average for September (423.3 mm).
But the rain wasn't the only problem. A tornado tore through areas from Shizunami, Makinohara City all the way to Ōhata, Yoshida Town, Shizuoka Prefecture. The Japan Meteorological Agency confirmed it was indeed a tornado1. In Makinohara alone, 74 people were injured and over 1,000 homes were damaged2.
Record-Breaking Tornado: Damage Seen Through User Weather Reports
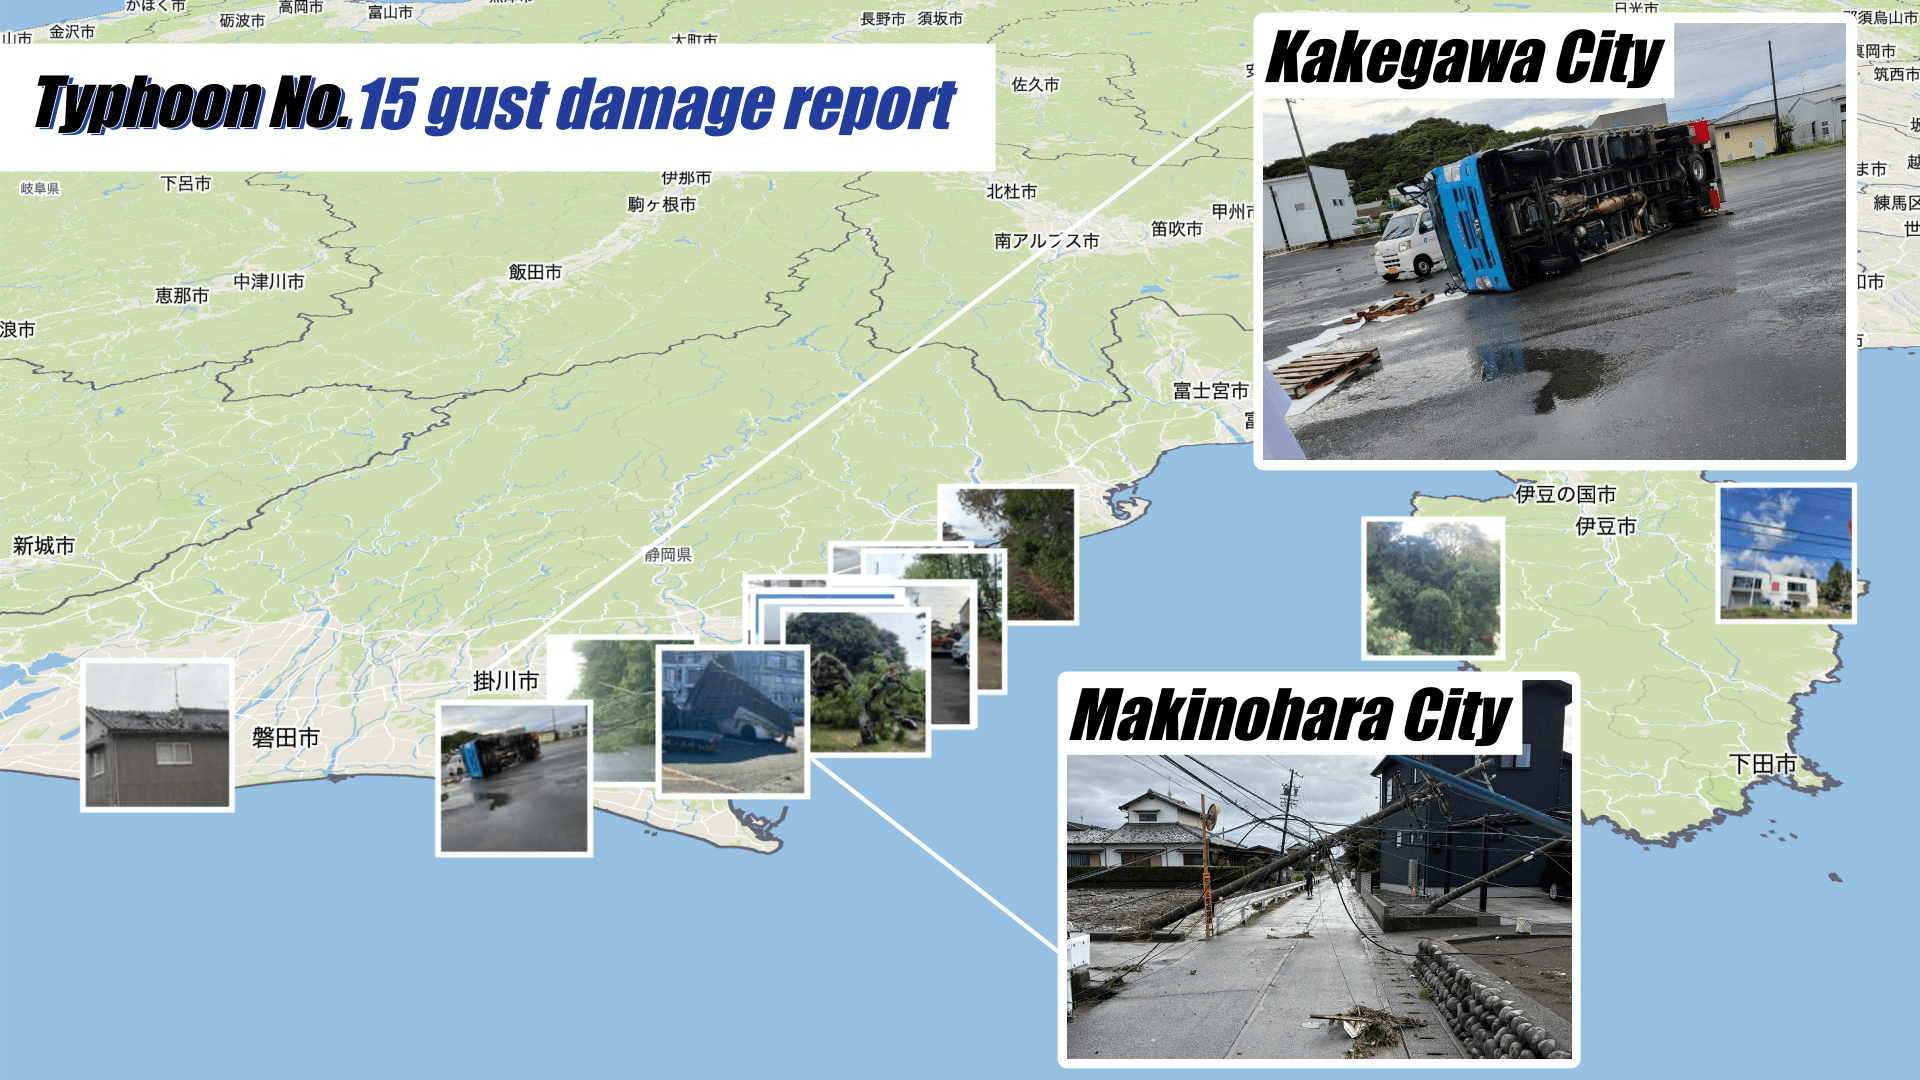
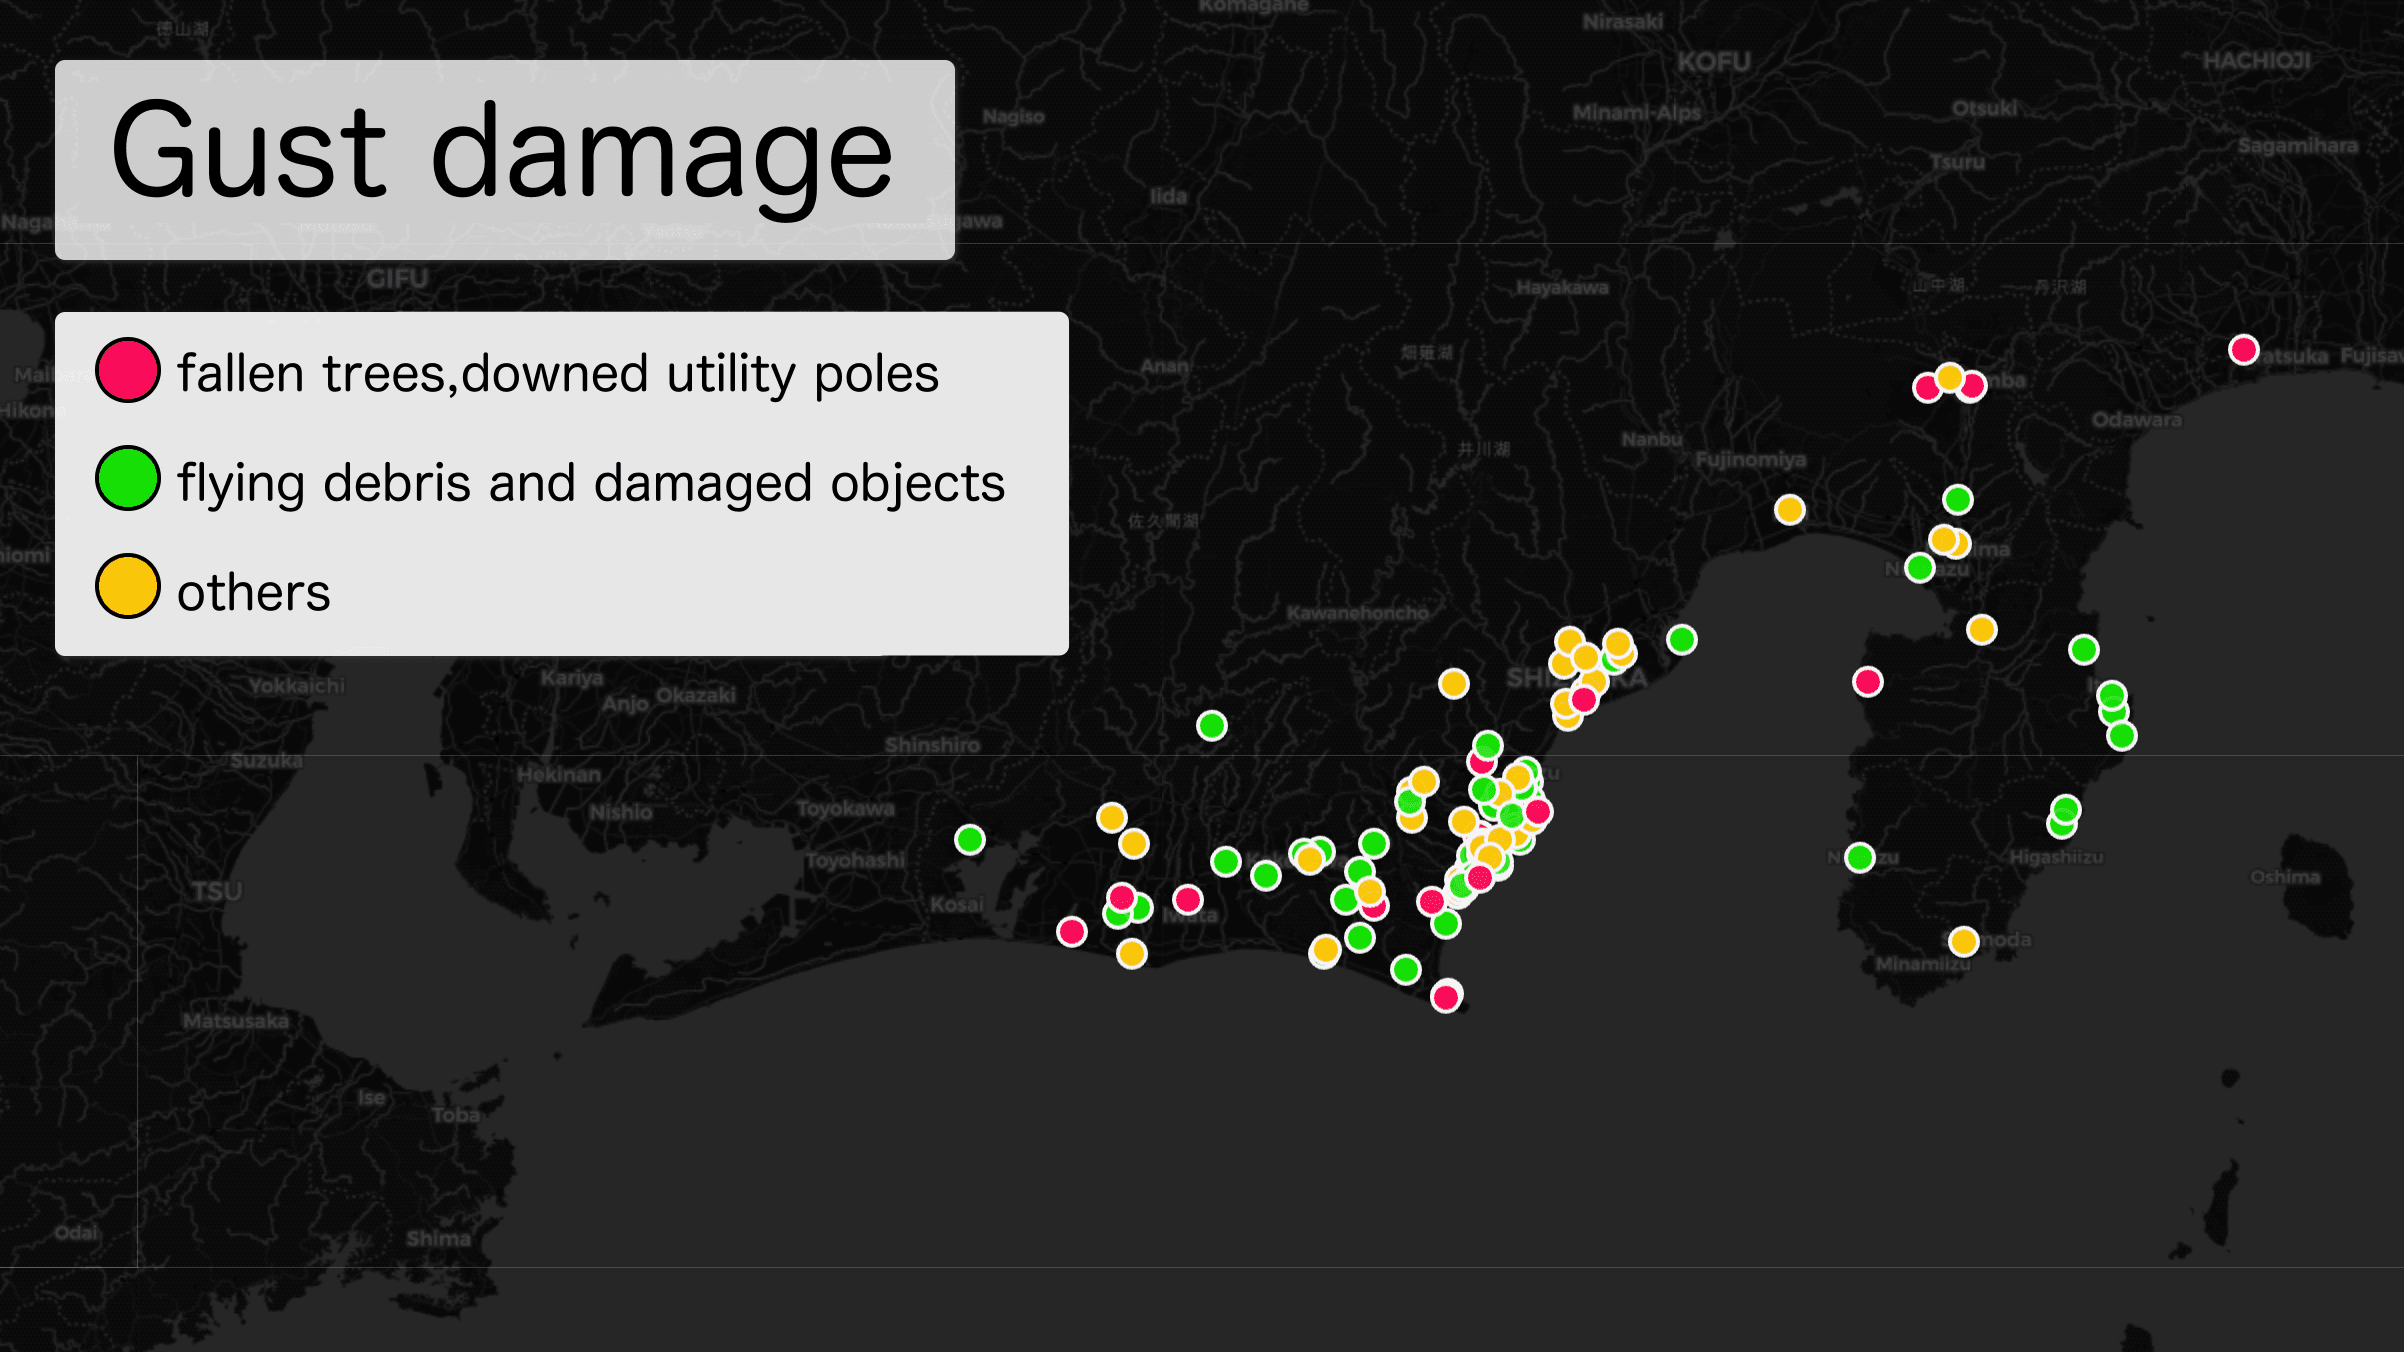
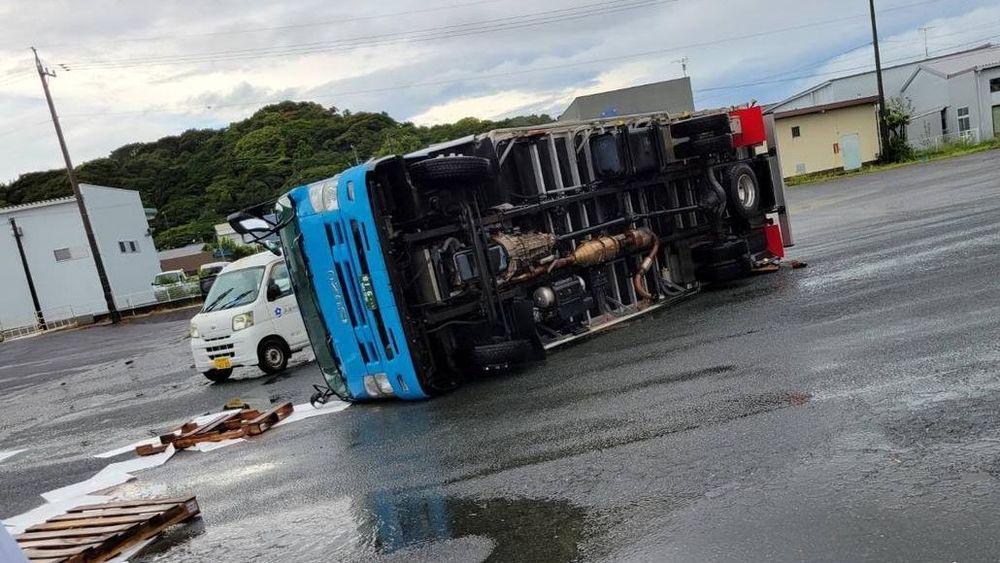
The tornado that struck Makinohara City through Yoshida Town reached level 3 on the Japan Enhanced Fujita Scale (JEF), the strongest tornado ever recorded in Japan, with estimated wind speeds of around 75 m/s1. Photos and videos submitted by Weathernews app users showed the extensive damage caused by these devastating winds (Figure 2,3).
Commentary from the Weathernews Forecast Center
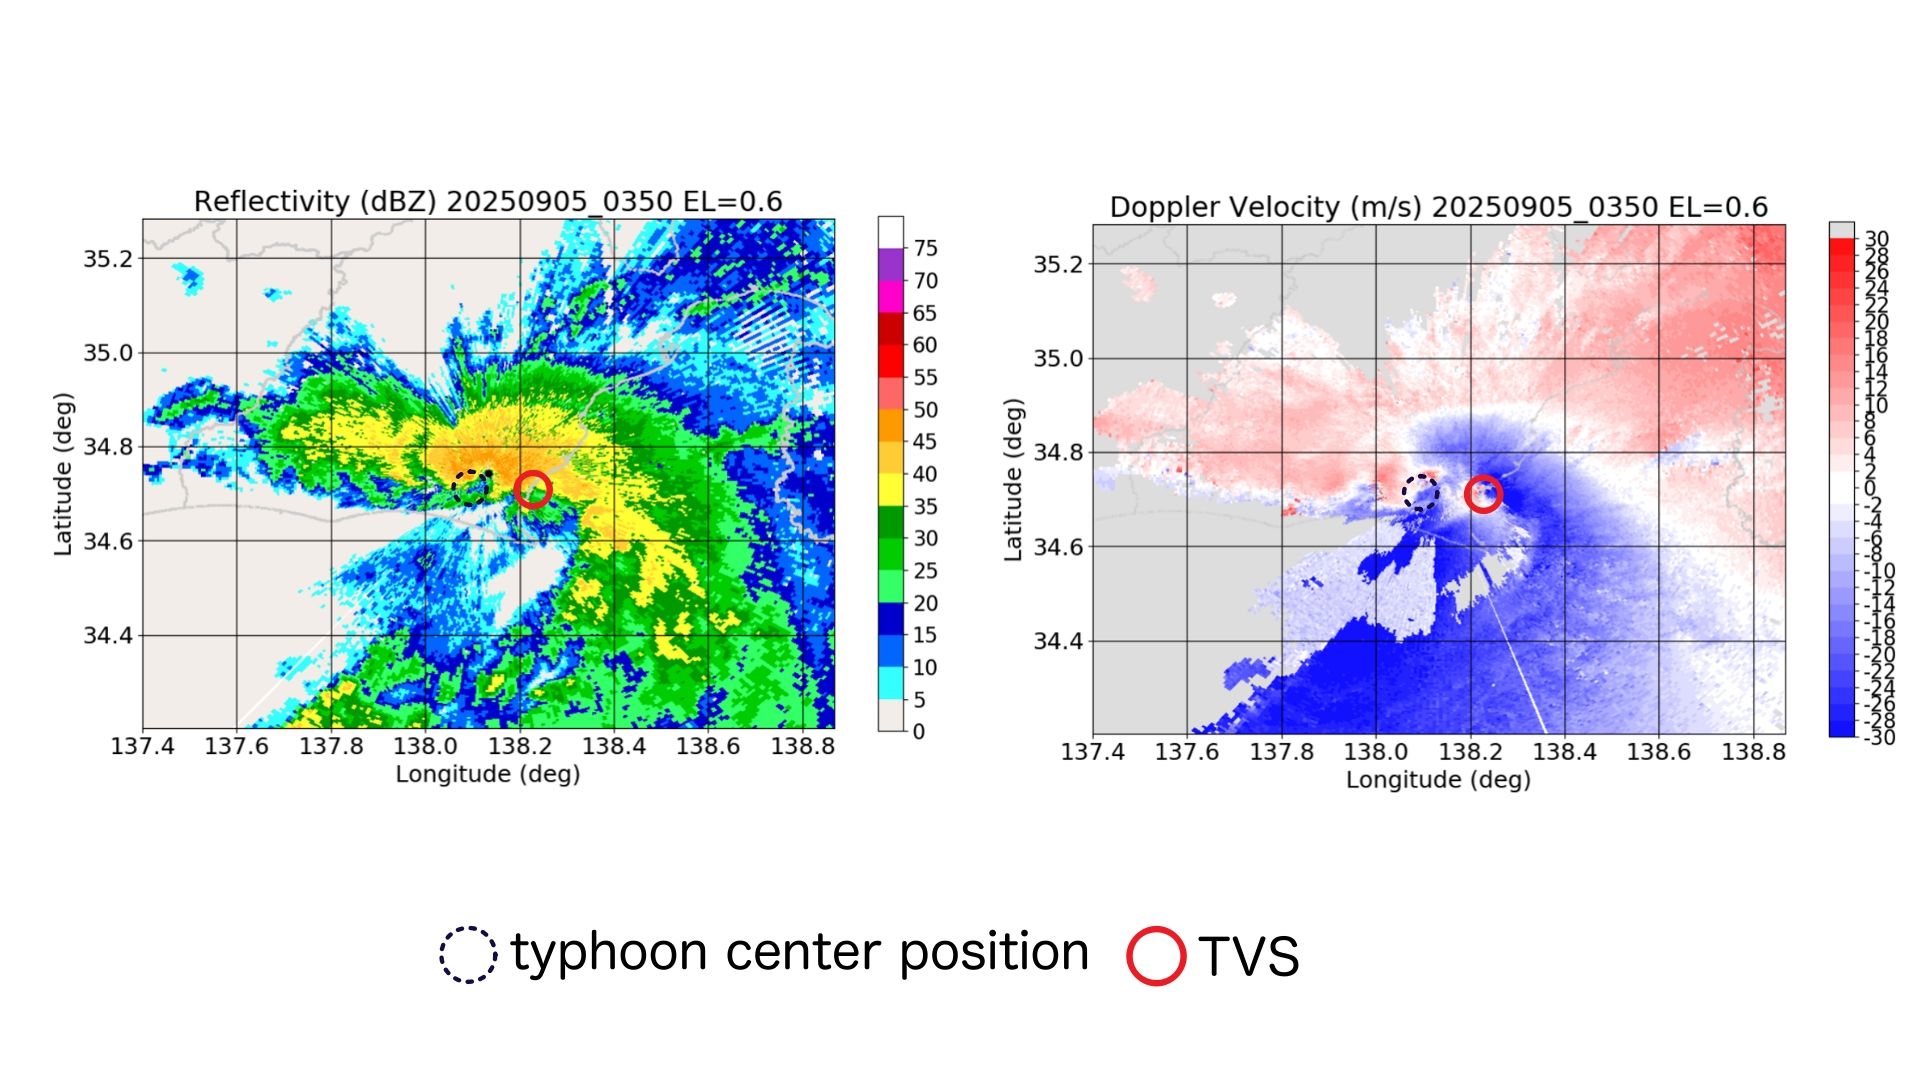
On September 5, when the tornado struck, our team analyzed Doppler radar data from our radar station in Makinohara. Figure 4 shows what we discovered: the left image displays rainfall intensity, while the right shows wind patterns. Red areas represent winds moving away from the radar, and blue shows winds moving toward it.
The red circle highlights a crucial area near longitude 138.2° and latitude 34.7°, where we found heavy rainfall with red and blue zones right next to each other. This pattern reveals powerful opposing wind currents creating rotation. It's a textbook example of what we call a Tornado Vortex Signature (TVS), which is a clear indicator of tornado formation.
Here's what made this tornado unusual: typically, typhoon-related tornadoes form 100 to 200 km east of the storm's center. But our Doppler analysis showed that this tornado, the one that devastated Makinohara City and Yoshida Town, actually formed much closer to the typhoon's eye than we'd normally expect.
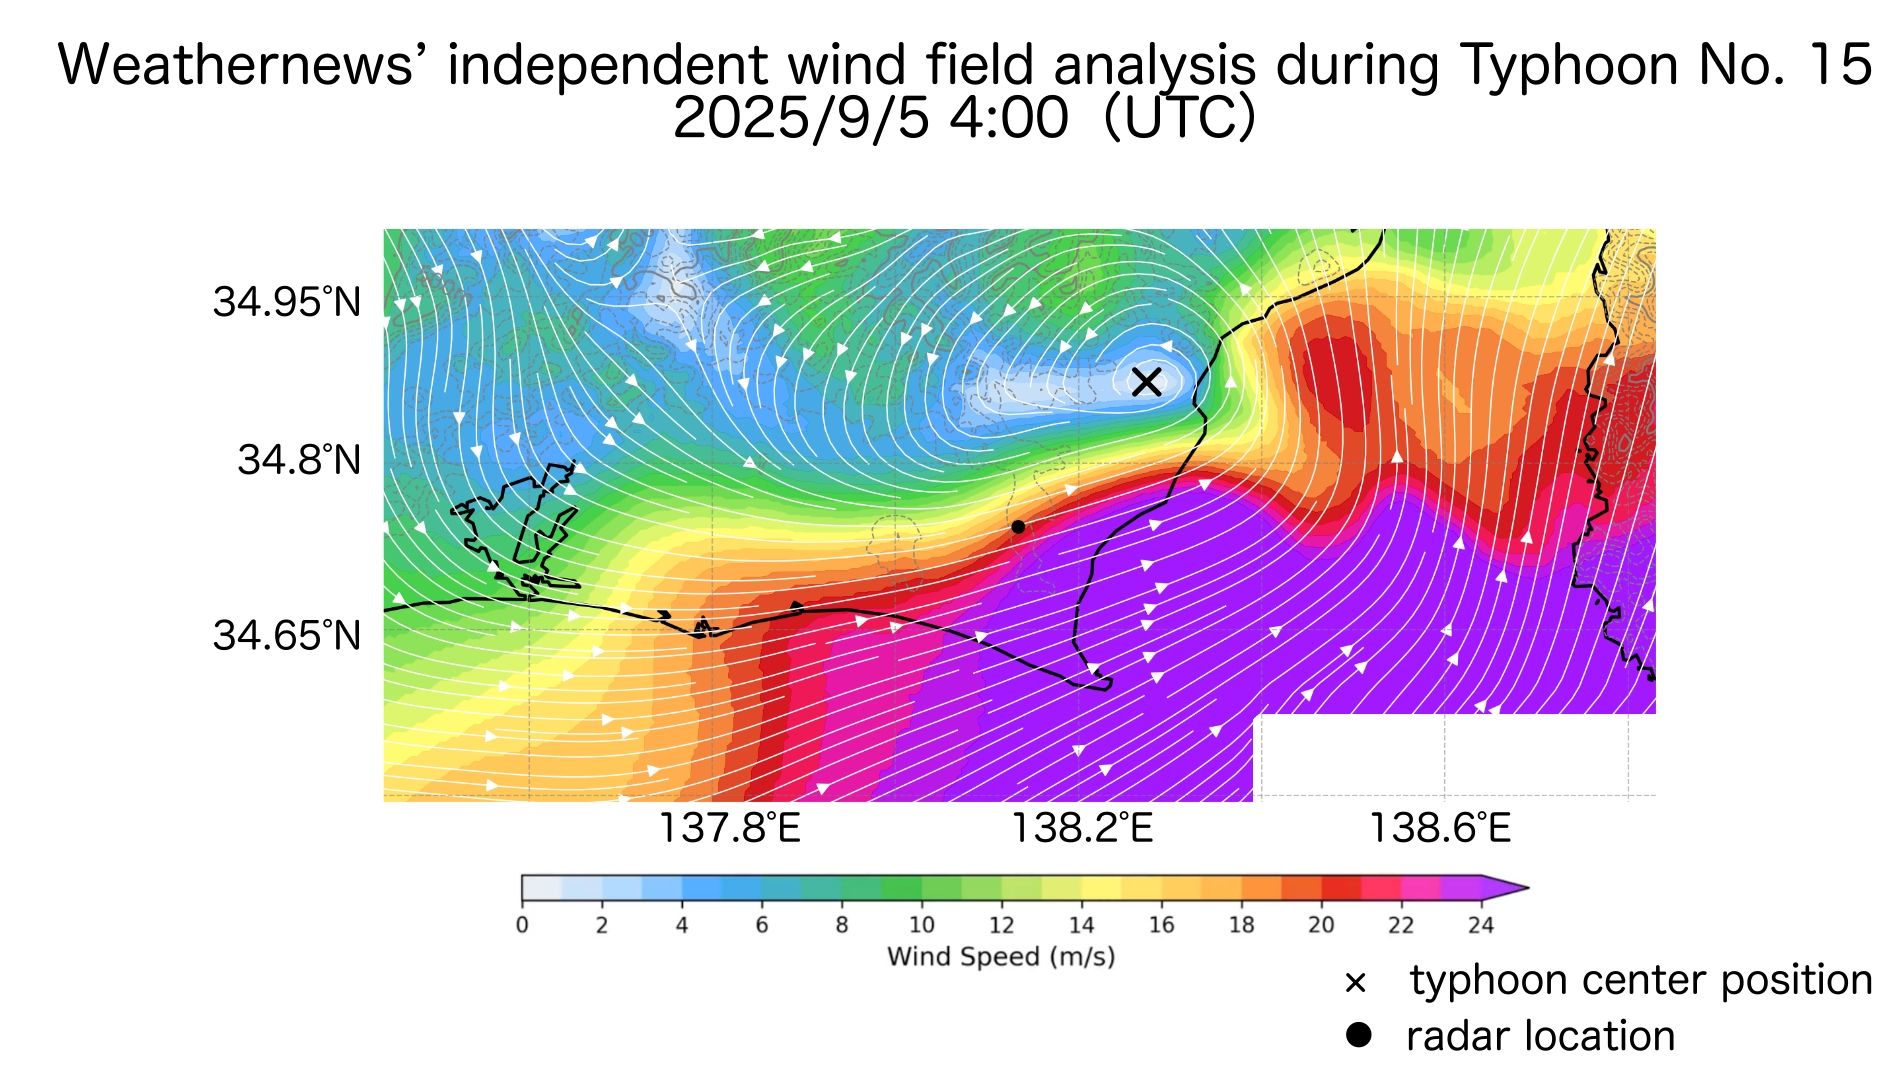
While damage surveys and wind speed estimates of 75 m/s confirm this was Japan's strongest tornado on record, what made it so incredibly powerful? The answer lies in the unique conditions near the typhoon's center that were perfect for tornado formation. The typhoon was already creating strong convective activity, but on top of that, a powerful stream of warm, humid air flowing in from the south supercharged the vertical air currents. This allowed the spinning vortex to reach all the way down to the ground and fully develop into a tornado (Figure 5).
At Weathernews, when users submit "Weather Reports" of funnel clouds (which appear just before or during tornado formation), our forecast team analyzes local weather conditions in real time. If a tornado is likely, we issue a "Tornado Alarm" through our app to alert users and encourage caution.
Because typhoons are made up of clusters of cumulonimbus clouds, conditions often align perfectly for tornado formation. With many typhoons approaching or making landfall in September, this month historically sees the highest number of tornado occurrences in Japan. We strongly encourage everyone to check the latest weather information and take all necessary safety measures when a typhoon approaches.
Evaluation of Track Forecast Accuracy
We evaluated the track forecasts for Typhoon No. 15 from eight global meteorological models. Figure6 shows the forecast tracks issued at 12:00 UTC on September 2, before the typhoon had even formed. Many models correctly predicted that the storm would make landfall in Kyushu, then turn eastward and move along Japan's Pacific coast.
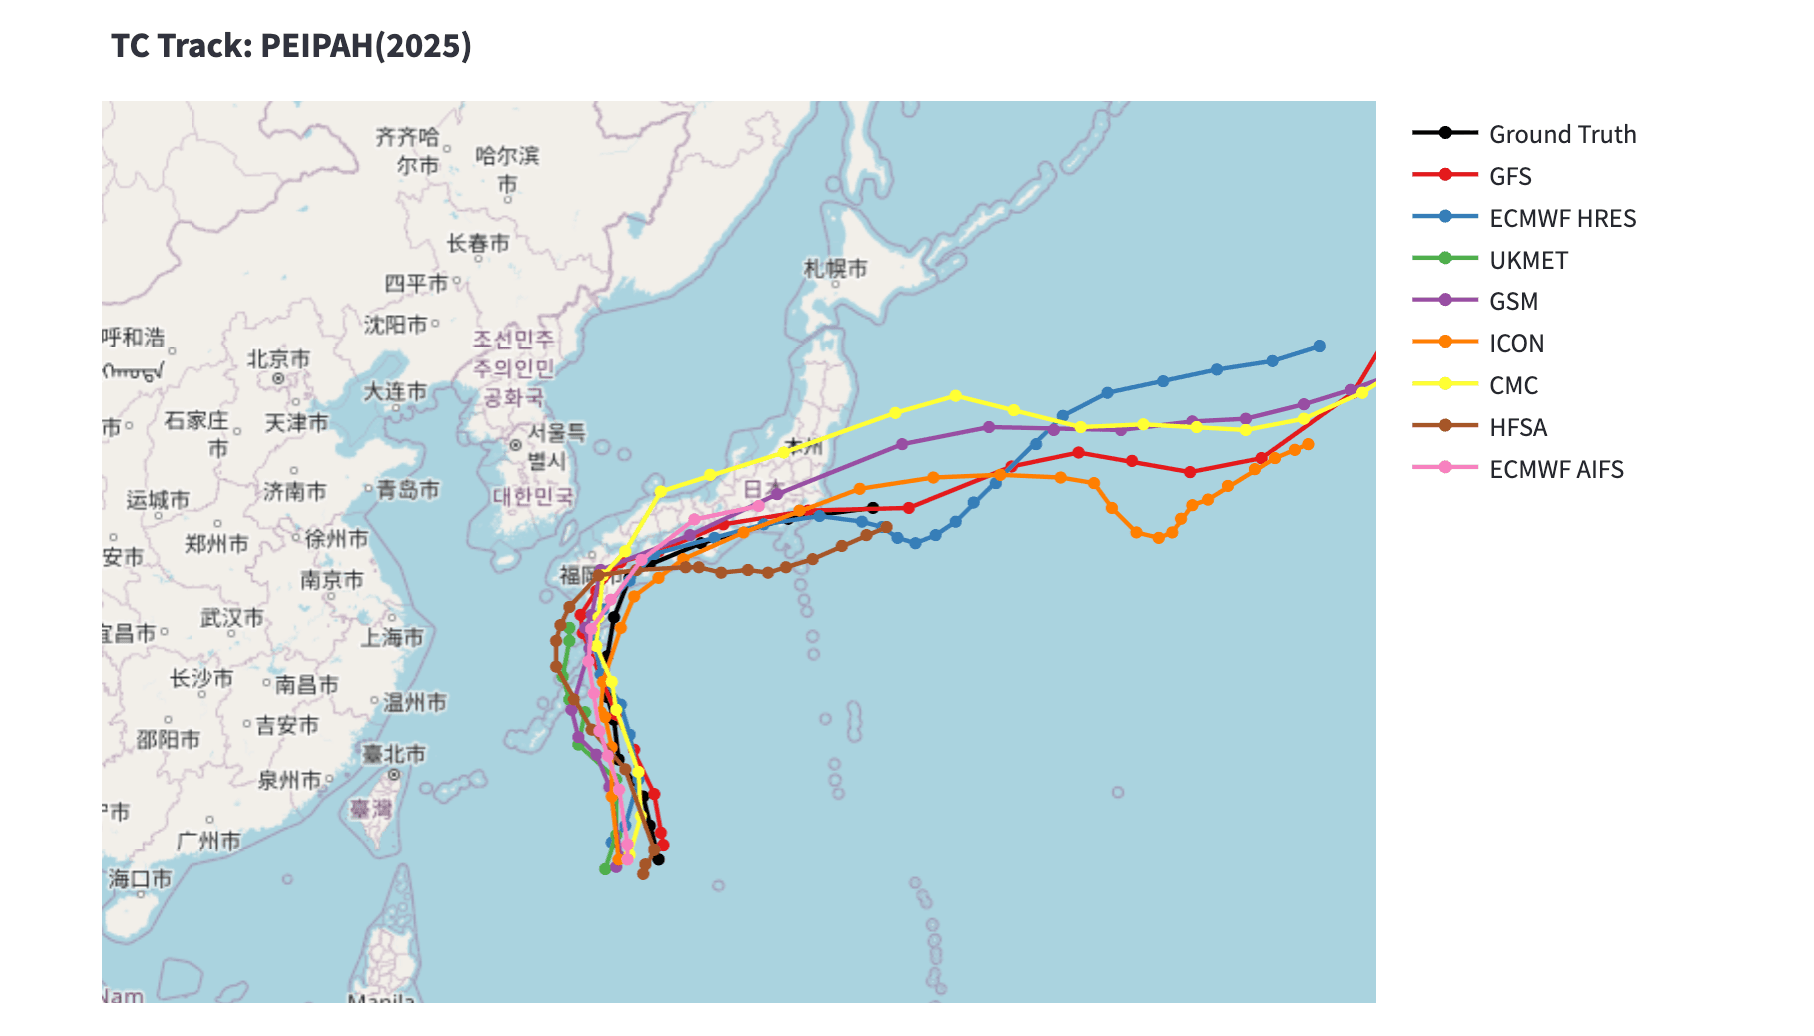
GFS (NCEP): U.S. National Centers for Environmental Prediction ECMWF: European Centre for Medium-Range Weather Forecasts UKMET: UK Met Office GSM (JMA): Japan Meteorological Agency CMC: Canadian Meteorological Centre HFSA (NOAA): U.S. National Oceanic and Atmospheric Administration ICON (DWD): Deutscher Wetterdienst (Germany)
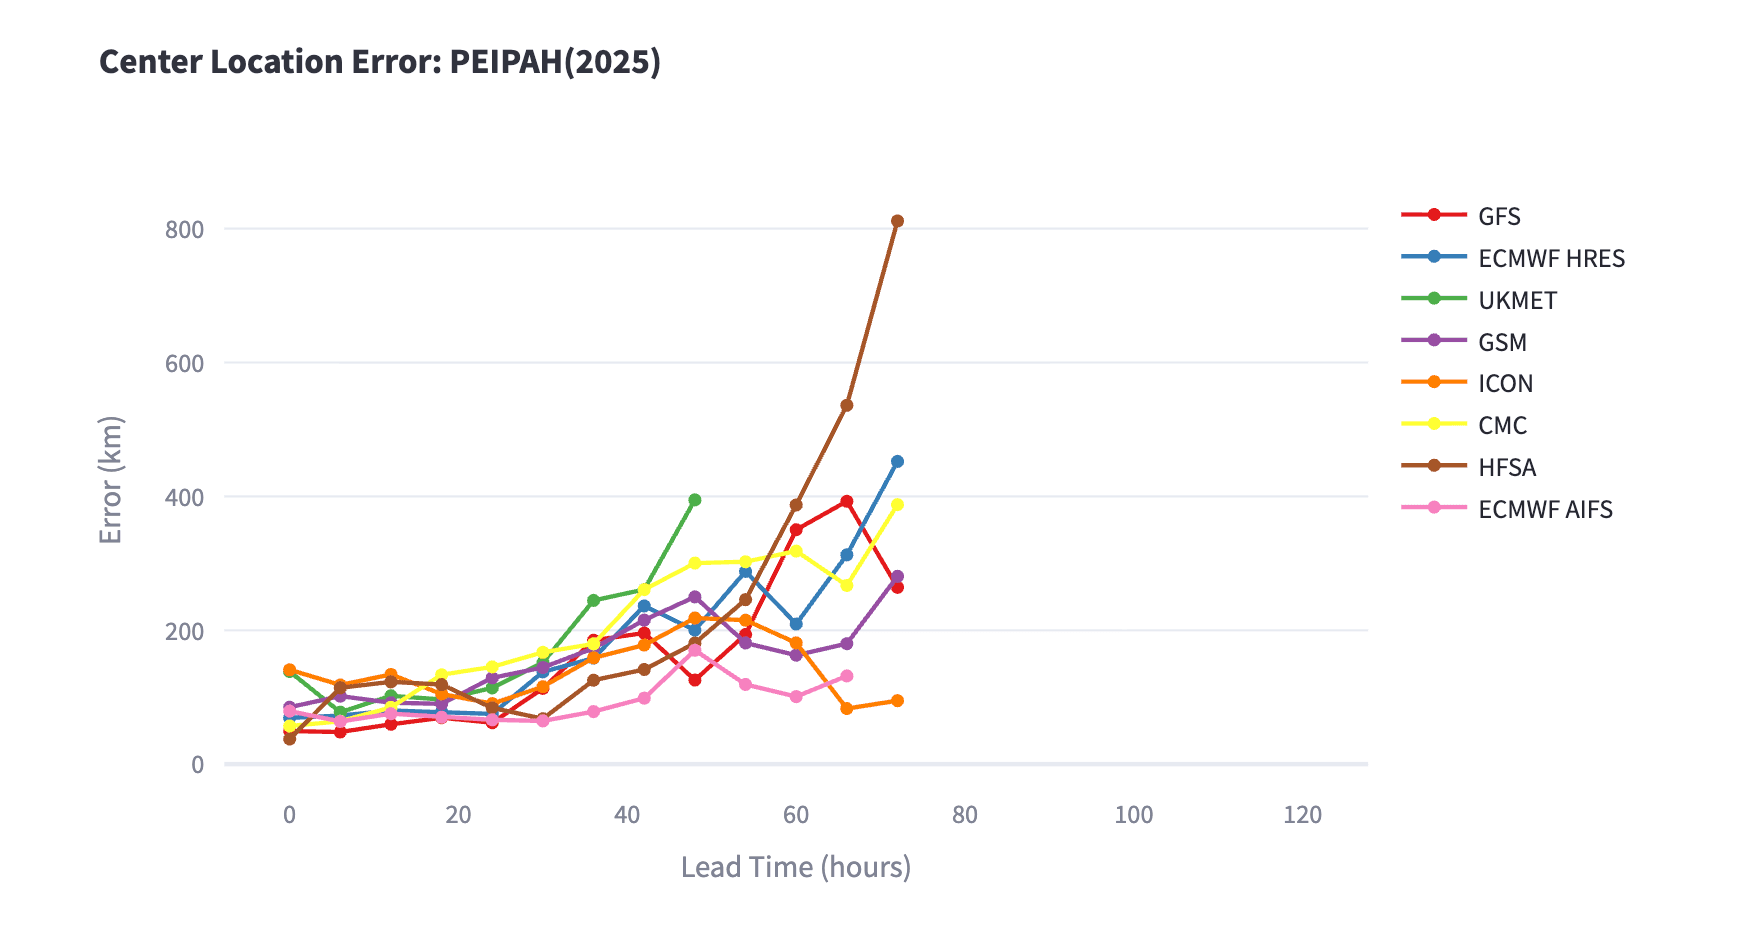
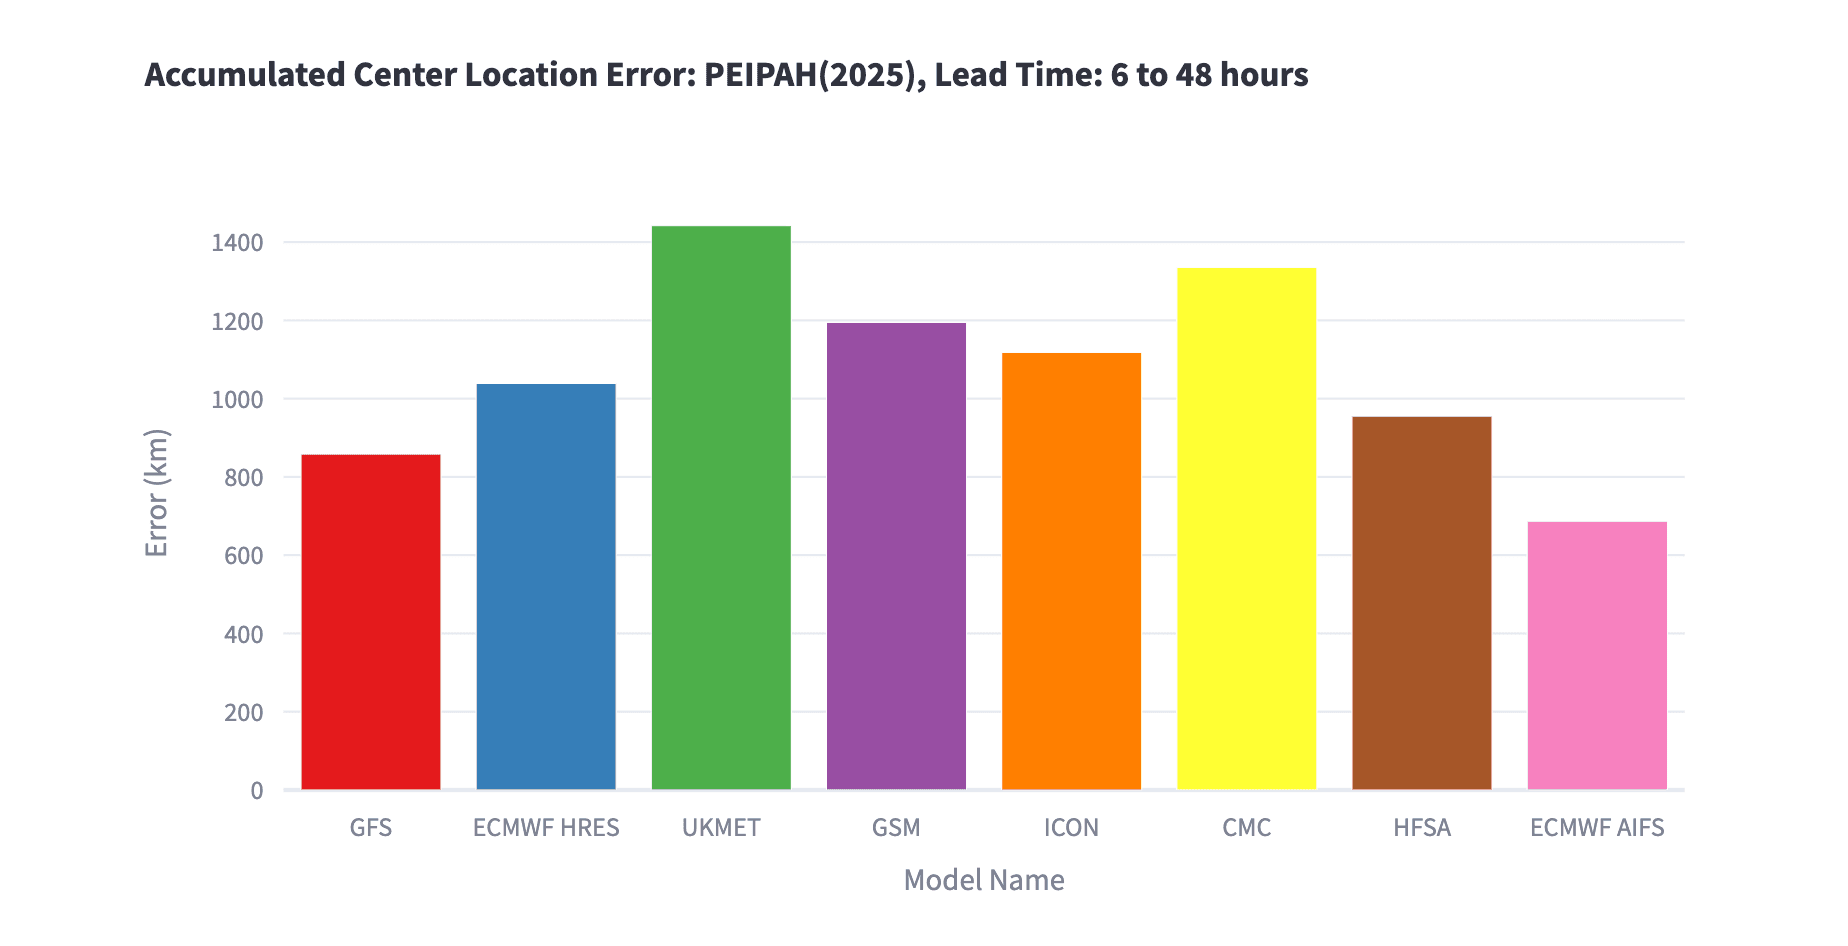
Figure7 shows the forecast error in the typhoon's central position over time. The ECMWF's AI Forecasting System (AIFS) kept errors under 200 km even with lead times of 60+ hours. Figure 8, which compares cumulative forecast errors, also shows that ECMWF AIFS had the highest accuracy. These results demonstrate that ECMWF AIFS provided the most accurate track forecasts for Typhoon No. 15.We also assessed rainfall forecasts. However, none of the global models predicted the extreme precipitation totals exceeding 400 mm that were actually observed in Japan.
At Weathernews, we work to provide highly accurate forecasts by combining our own prediction models with ensemble forecasting that brings together multiple global models. Through ongoing verification of model performance, including AI-based approaches, we aim to better understand each model's strengths and deliver more reliable weather information to our users.
Footnotes
Share

March 13, 2026
How TV Stations Are Transforming Weather Coverage A New Content Solution Helping Broadcasters Navigate Weather and Disaster Reporting
March 6, 2026
Weathernews Launches Comprehensive BCP Service: Emergency Confirmation Powered by Weather Expertise

March 6, 2026
Taking on Japan's Most Widespread Health Challenge with Data and Passion: Why Weathernews Continues to Strengthen Its Pollen Information and the Commitment Behind It