News & Press Release
Weathernews Looks Back at 2015: A Year of Storms
Global Center > Hanoi Office > Hong Kong Office > Manila Office > Seoul Office > Shanghai Office > Singapore Office > Taipei Office >Powerful Typhoons Occurred with Changing Patterns in El Niño Years
Weathernews Inc. (Chiba, Japan; Chihito Kusabiraki/CEO) has analyzed the unusually frequent occurrence of tropical cyclones in the western north Pacific Ocean last year. Last month, Typhoon Melor became the last of typhoon of 2015, a year that saw the occurrence of at least one tropical storm every month. Among the twenty-seven named storms seen in 2015, eighteen of them were full-fledged typhoons. This is thought to be the influence of the current El Niño phenomenon which started after summer of 2014, and is one of the strongest ever El Niño events on record. This El Niño event is peaking now, and is expected to dissipate by summer of 2016. Based on past El Niño years that peaked near the end of the year and dissipated in the spring/summer of the following years, tropical cyclones in the dissipating year tend to be fewer and weaker. Weathernews continues to monitor and forecast the development of tropical cyclones that can have a major impact on people.
2015 Typhoon Season: El Niño Event Leads to First Time on Record for Monthly Development of Tropical Cyclones
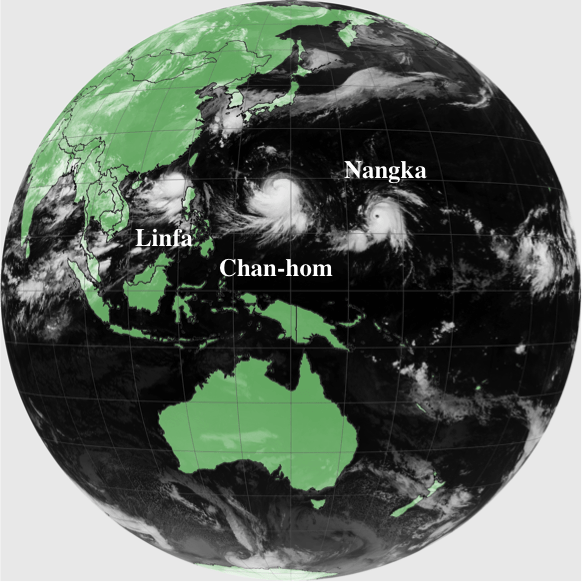
Tropical cyclones occurred in every month of the year in 2015. Four occurred in the winter when tropical cyclones typically do not occur. Three cyclones existed simultaneously in July (see Figure 1). This became the fastest pace of tropical cyclone generation in recorded history. The previous record was set in January to November 1965, for eleven months consecutive development of tropical cyclones. However, 2015 was the first time since records began in 1951 that at least one cyclone formed every month of the year. The longest string of tropical cyclones across years was a nineteen-month stretch from May 1964 to November 1965. This was tied with this chain of storms, for a nineteen-month period from June 2014 to December 2015.
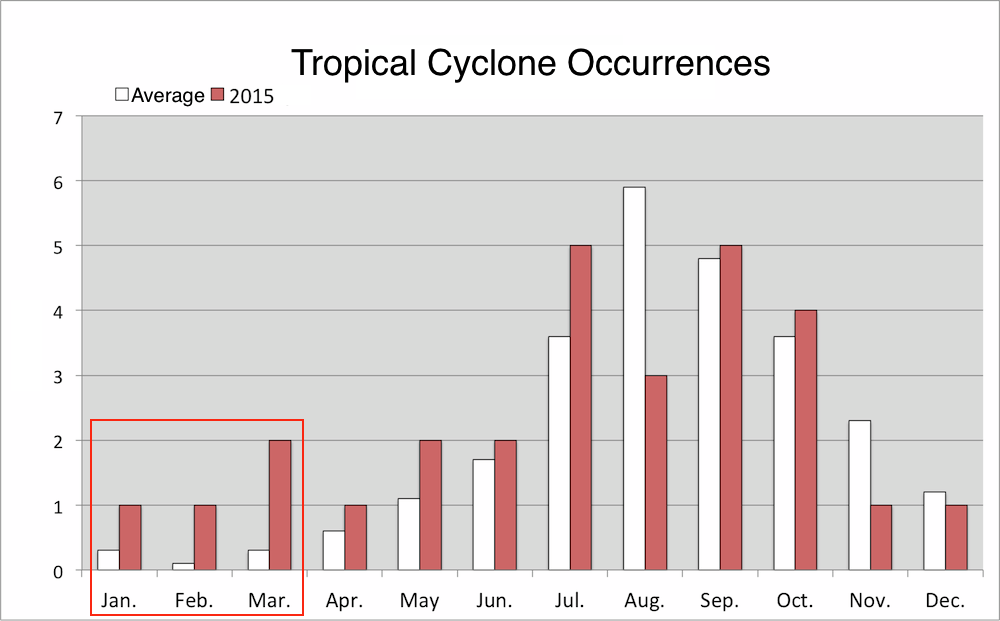
This monthly development of tropical cyclones in 2015 is believed to be related to sea surface temperatures (SST) across tropical regions. If we compare 2015 monthly occurrences of tropical cyclones to yearly averages (see Figure 2), we see that 1-2 cyclones formed in the winter months between January to March, when tropical cyclones typically do not form.
We can see that SST in the central Pacific (circled area) were 1-2℃ warmer than average. The warmer than usual seas provided more water vapor to fuel convection, resulting in better conditions for the development of tropical cyclones through December.
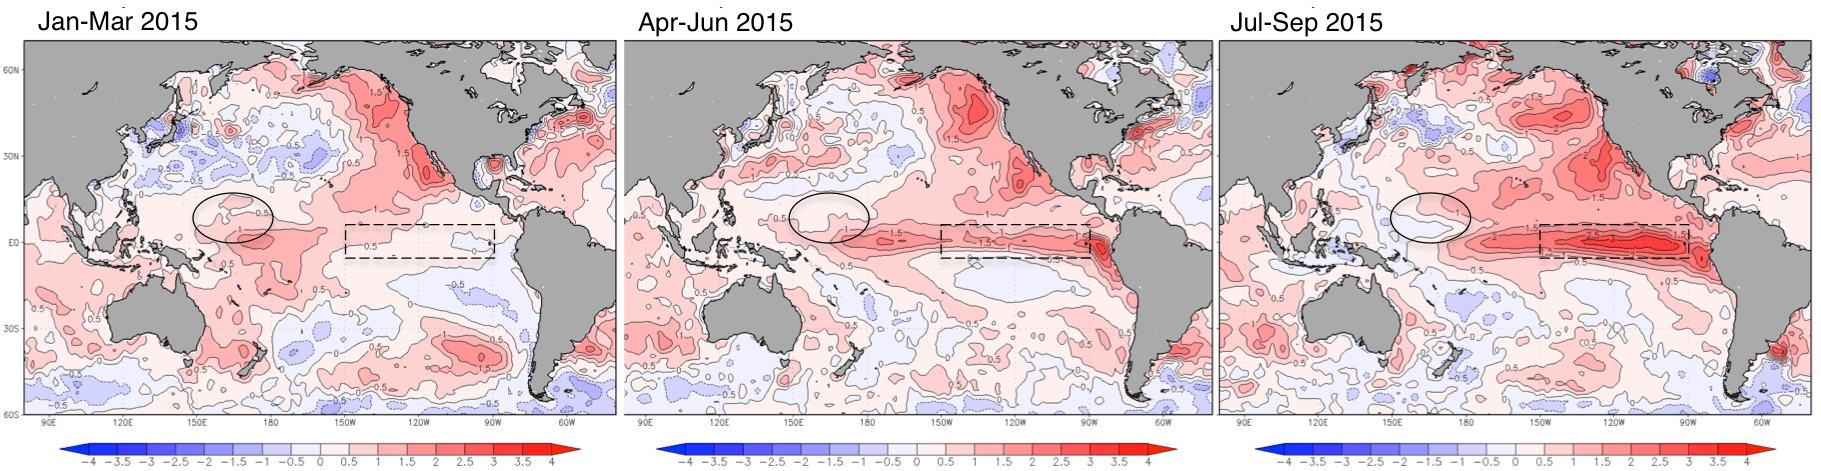
Higher than average SST in the central Pacific continued after April, and reached their peak of approximately 3℃ above the average even in regions further east along the equator. This is a telltale sign of the El Niño phenomenon.
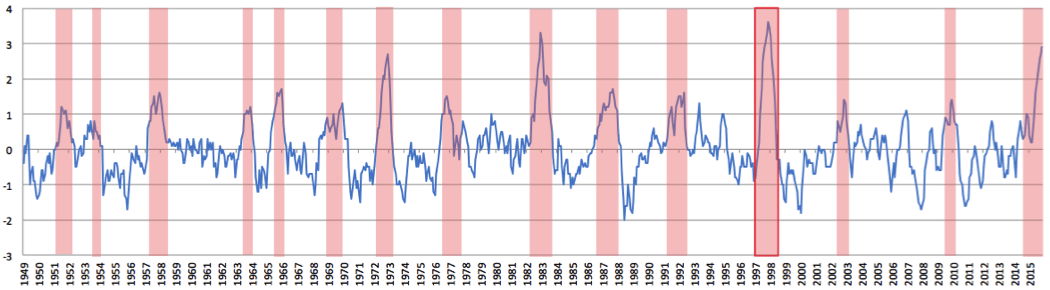
El Niño is defined by the SST differences in El Niño monitoring regions (boxed areas in Figure 3). If we look at the differences between average SST in the El Niño monitoring regions since 1949 (Figure 4), November 2015 (far right side of Figure 4) was about 3℃ higher than average. This is similar to the strongest El Niño of the 20th century, which lasted from 1997 to 1998.
◆El Nino and Characteristics of Tropical Cyclone Trends
Research of tropical cyclone development tendencies during El Niño events shows a correlation as per below.
Tropical Cyclone Development Infrequent in Years of El Niño Dissipation
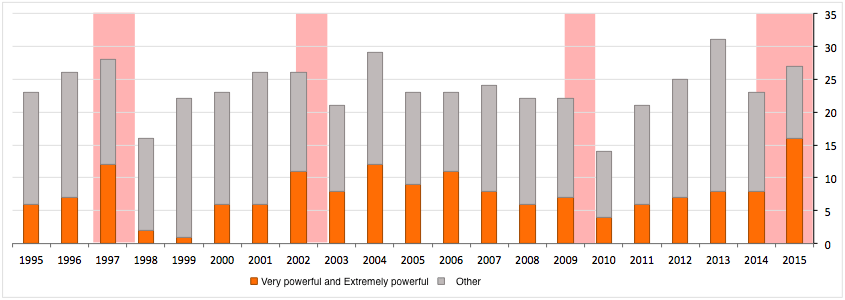
An annual average of twenty-four tropical cyclones have occurred over the twenty-one year period from 1995 to 2015. According to Figure 5, in years when the El Niño phenomenon weakens there seems to be a trend of less than the average number of tropical cyclones occurring (16 in 1998, 21 in 2003 and 14 in 2010). On the other hand, in years when El Niño is in a strengthening stage, we cannot state for certain that tropical cyclones occur more often.
Stronger Tropical Cyclones with Stronger El Niño
Very powerful typhoons (wind speeds between to 44~54m/s) and extremely powerful typhoons (wind speeds exceeding 54m/s) have occurred an annual average of eight times between 1995 and 2015. However, sixteen typhoons reach these levels of intensity in 2015. This is much more than the eleven in 2002, and twelve occurring in 1997; both strong El Niño years (Figure 5). This does not mean that many tropical cyclones will always occur in El Niño years, but the strength of the El Niño phenomenon may affect the likelihood that tropical cyclones will occur.
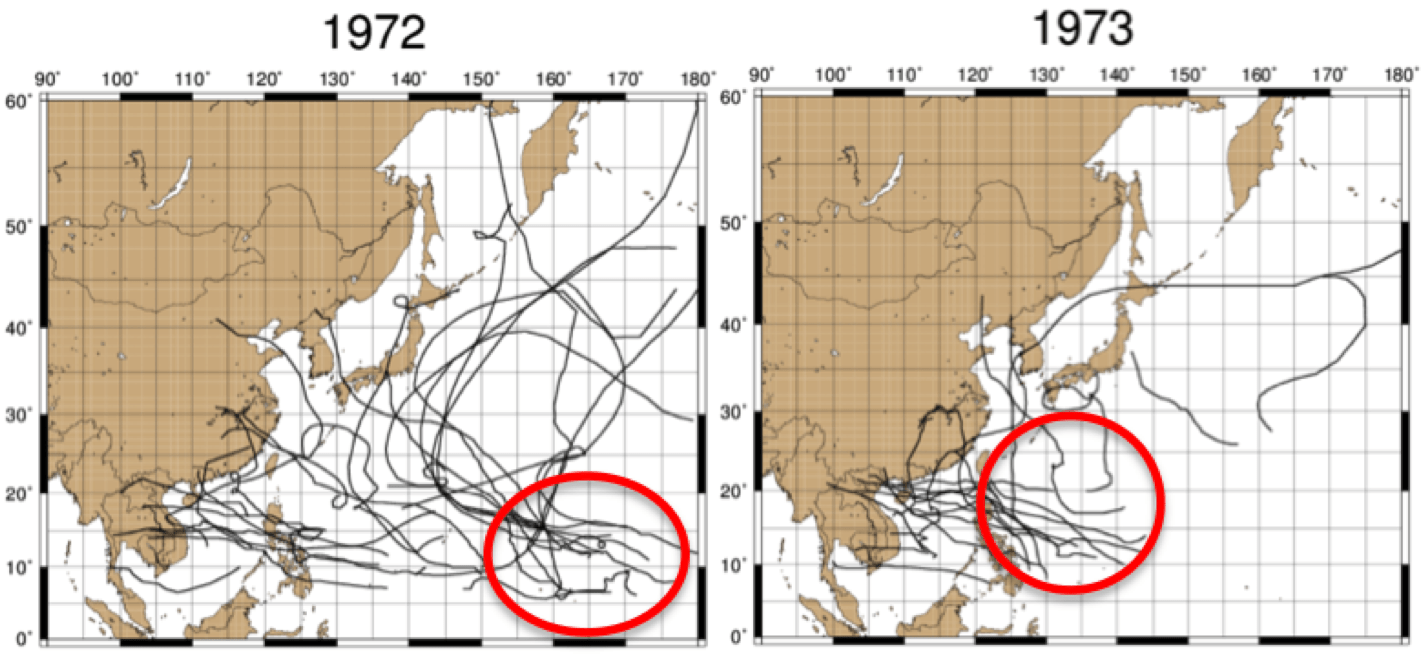
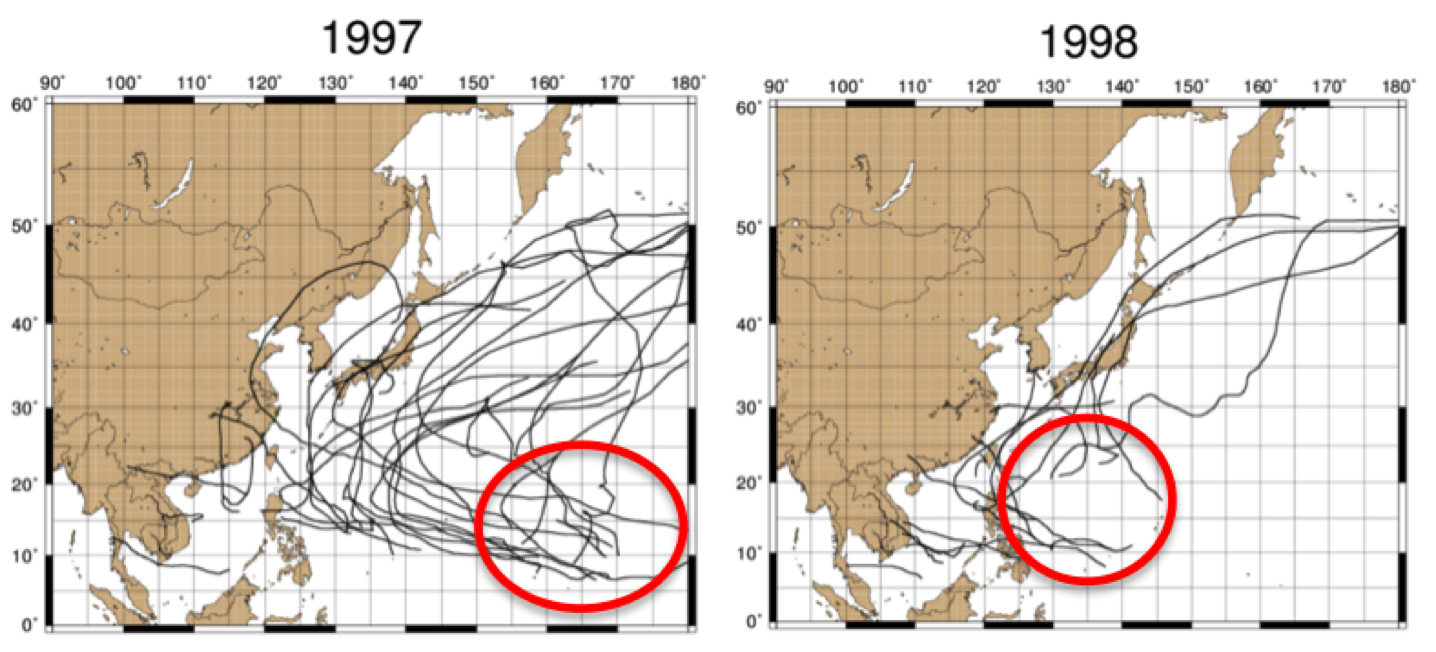
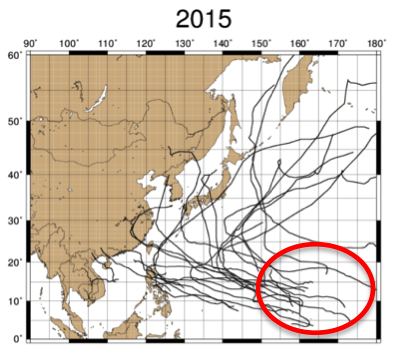
One reason is the change in the area where tropical cyclones develop. In El Niño years like 1972, 1997 and 2015, many tropical cyclones formed east of 150-degrees east longitude (Figure 6). As seen in Figure 3, when El Niño develops, the SST increase far east of the Philippines, so convective activity strengthens, and there is a stronger possibility that tropical cyclones will develop. On the other hand, in years when El Niño weakens, like 1973 and 1998, relatively fewer tropical cyclones occurred east of 150-degrees east longitude than in the previous year, and most of these formed west of 145-degrees east longitude. Another characteristic is that in the seas south of Japan, the tropical cyclones tend to form more often in comparatively higher latitudes north of 20-degrees north.
The area of initial formation also factors into how far the tropical cyclones develop. The further east a tropical cyclone develops in the lower latitudes, it spends more time tracking over warm waters and tends to grow stronger. At the same time, the further west a tropical cyclone forms, the sooner it makes landfall and dissipates before it has the chance to strengthen further.
That is to say, in years that El Niño develops, tropical cyclone development moves further east where conditions are more favorable, and they spend more time over areas of higher SST.
The current El Niño event is peaking, and is expected to start weakening from here on. From past trends of dissipating El Niño years, the number of tropical cyclones in 2016 is expected to be less than 2015.
Weathernews continues to monitor and forecast the development of tropical cyclones that can have a major impact on peoples' lives, and make efforts to minimize this impact.